
SPECpower_ssj2008
Host 'NODE04' Performance Report
Copyright © 2007-2019 Standard Performance Evaluation Corporation
| Hewlett Packard Enterprise Synergy 480 Gen10 Compute Module | ssj_ops@100% = 5,768,461 ssj_ops@100% per JVM = 1,442,115 |
||||
| Test Sponsor: | Hewlett Packard Enterprise | SPEC License #: | 3 | Test Method: | Multi Node |
| Tested By: | Hewlett Packard Enterprise | Test Location: | Houston, TX, USA | Test Date: | Mar 27, 2019 |
| Hardware Availability: | Apr-2019 | Software Availability: | Mar-2019 | Publication: | May 8, 2019 |
| System Source: | Single Supplier | System Designation: | Server | Power Provisioning: | Line-powered |
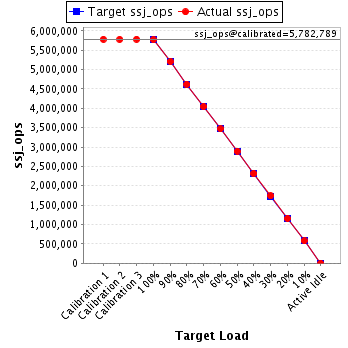
| Target Load | Actual Load | ssj_ops | |
|---|---|---|---|
| Target | Actual | ||
| Calibration 1 | 5,782,685 | ||
| Calibration 2 | 5,780,682 | ||
| Calibration 3 | 5,784,897 | ||
| ssj_ops@calibrated=5,782,789 | |||
| 100% | 99.8% | 5,782,789 | 5,768,461 |
| 90% | 90.0% | 5,204,511 | 5,207,039 |
| 80% | 79.9% | 4,626,232 | 4,621,279 |
| 70% | 70.0% | 4,047,953 | 4,047,332 |
| 60% | 60.0% | 3,469,674 | 3,466,813 |
| 50% | 50.1% | 2,891,395 | 2,895,604 |
| 40% | 40.0% | 2,313,116 | 2,313,179 |
| 30% | 30.0% | 1,734,837 | 1,737,297 |
| 20% | 20.0% | 1,156,558 | 1,155,331 |
| 10% | 10.0% | 578,279 | 577,500 |
| Active Idle | 0 | 0 | |
| Set Identifier: | SUT |
| Set Description: | System Under Test |
| # of Identical Nodes: | 4 |
| Comment: | SUT |
| Hardware | |
|---|---|
| Hardware Vendor: | Hewlett Packard Enterprise |
| Model: | Synergy 480 Gen10 Compute Module |
| Form Factor: | 7U |
| CPU Name: | Intel Xeon Platinum 8280 @ 2.70GHz (Intel Turbo Boost Technology up to 4.00 GHz) |
| CPU Characteristics: | 28-Core, 2.70 GHz, 38.5MB L3 Cache |
| CPU Frequency (MHz): | 2700 |
| CPU(s) Enabled: | 56 cores, 2 chips, 28 cores/chip |
| Hardware Threads: | 112 (2 / core) |
| CPU(s) Orderable: | 1,2 chips |
| Primary Cache: | 32 KB I + 32 KB D on chip per core |
| Secondary Cache: | 1 MB I+D on chip per core |
| Tertiary Cache: | 39424 KB I+D on chip per chip |
| Other Cache: | None |
| Memory Amount (GB): | 192 |
| # and size of DIMM: | 12 x 16384 MB |
| Memory Details: | 12 x 16GB 2Rx8 PC4-2933Y-R; slots 1, 3, 5, 8, 10 and 12 populated in each socket |
| Power Supply Quantity and Rating (W): | None |
| Power Supply Details: | N/A |
| Disk Drive: | 1 x HPE 240GB 6G SATA M.2 SSD (875488-B21) |
| Disk Controller: | HPE Smart Array S100i SR Gen10 |
| # and type of Network Interface Cards (NICs) Installed: | 1 x HPE Synergy 3820C 10/20Gb CNA |
| NICs Enabled in Firmware / OS / Connected: | 2/2/1 |
| Network Speed (Mbit): | 1000 |
| Keyboard: | None |
| Mouse: | None |
| Monitor: | None |
| Optical Drives: | No |
| Other Hardware: | H/S: Standard |
| Software | |
|---|---|
| Power Management: | Enabled (see SUT Notes) |
| Operating System (OS): | Windows Server 2012 R2 Datacenter |
| OS Version: | Version 6.3 (Build 9600) |
| Filesystem: | NTFS |
| JVM Vendor: | Oracle Corporation |
| JVM Version: | Oracle Java HotSpot(TM) 64-Bit Server VM (build 24.80-b11, mixed mode), version 1.7.0_80 |
| JVM Command-line Options: | -server -Xmn21000m -Xms24000m -Xmx24000m -XX:SurvivorRatio=1 -XX:TargetSurvivorRatio=99 -XX:AllocatePrefetchDistance=256 -XX:AllocatePrefetchLines=4 -XX:LoopUnrollLimit=45 -XX:InitialTenuringThreshold=12 -XX:MaxTenuringThreshold=15 -XX:ParallelGCThreads=28 -XX:InlineSmallCode=3900 -XX:MaxInlineSize=270 -XX:FreqInlineSize=2500 -XX:+AggressiveOpts -XX:+UseLargePages -XX:+UseParallelOldGC |
| JVM Affinity: | start /NODE [0,1,2,3] /AFFINITY [0xFFFFFFF] |
| JVM Instances: | 4 |
| JVM Initial Heap (MB): | 24000 |
| JVM Maximum Heap (MB): | 24000 |
| JVM Address Bits: | 64 |
| Boot Firmware Version: | I42 v2.00 (02/02/2019) |
| Management Firmware Version: | 1.40 Feb 05 2019 |
| Workload Version: | SSJ 1.2.10 |
| Director Location: | Controller |
| Other Software: | HPE Service Pack for ProLiant (SPP) Version: 2019.03.0, Microsoft Windows KB4056898, KB4338815 |
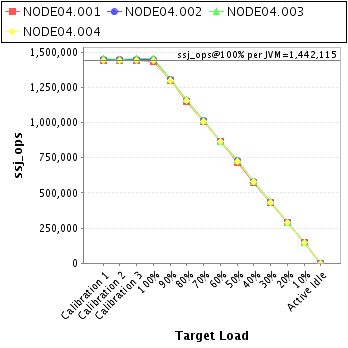
| JVM Instance | ssj_ops@100% |
|---|---|
| NODE04.001 | 1,433,958 |
| NODE04.002 | 1,444,300 |
| NODE04.003 | 1,452,119 |
| NODE04.004 | 1,438,083 |
| ssj_ops@100% | 5,768,461 |
| ssj_ops@100% per JVM | 1,442,115 |
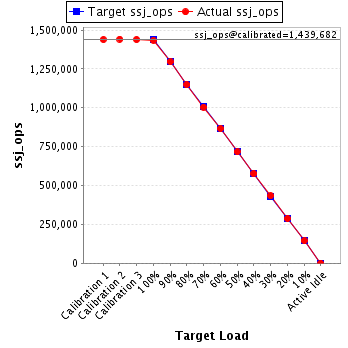
| Target Load | Actual Load | ssj_ops | |
|---|---|---|---|
| Target | Actual | ||
| Calibration 1 | 1,438,596 | ||
| Calibration 2 | 1,441,309 | ||
| Calibration 3 | 1,438,055 | ||
| ssj_ops@calibrated=1,439,682 | |||
| 100% | 99.6% | 1,439,682 | 1,433,958 |
| 90% | 90.0% | 1,295,714 | 1,296,041 |
| 80% | 79.8% | 1,151,745 | 1,149,125 |
| 70% | 69.8% | 1,007,777 | 1,004,984 |
| 60% | 60.2% | 863,809 | 866,068 |
| 50% | 49.7% | 719,841 | 716,066 |
| 40% | 40.0% | 575,873 | 575,433 |
| 30% | 30.1% | 431,905 | 433,341 |
| 20% | 19.9% | 287,936 | 286,995 |
| 10% | 10.0% | 143,968 | 144,414 |
| Active Idle | 0 | 0 | |
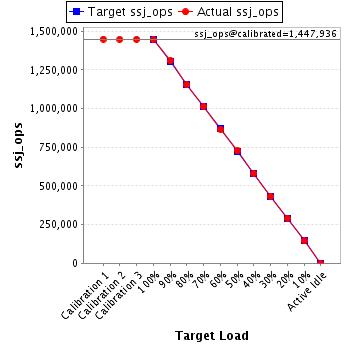
| Target Load | Actual Load | ssj_ops | |
|---|---|---|---|
| Target | Actual | ||
| Calibration 1 | 1,449,010 | ||
| Calibration 2 | 1,447,937 | ||
| Calibration 3 | 1,447,935 | ||
| ssj_ops@calibrated=1,447,936 | |||
| 100% | 99.7% | 1,447,936 | 1,444,300 |
| 90% | 90.3% | 1,303,143 | 1,308,127 |
| 80% | 79.8% | 1,158,349 | 1,155,734 |
| 70% | 70.1% | 1,013,555 | 1,014,348 |
| 60% | 59.8% | 868,762 | 866,203 |
| 50% | 50.2% | 723,968 | 726,968 |
| 40% | 40.0% | 579,174 | 579,522 |
| 30% | 30.0% | 434,381 | 434,261 |
| 20% | 20.1% | 289,587 | 290,651 |
| 10% | 10.0% | 144,794 | 144,539 |
| Active Idle | 0 | 0 | |
| Target Load | Actual Load | ssj_ops | |
|---|---|---|---|
| Target | Actual | ||
| Calibration 1 | 1,453,017 | ||
| Calibration 2 | 1,450,819 | ||
| Calibration 3 | 1,457,001 | ||
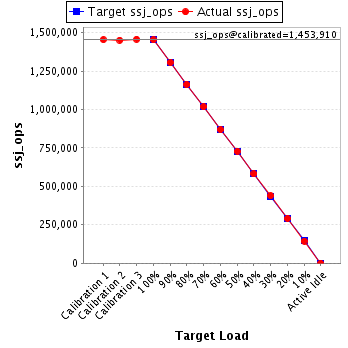
| ssj_ops@calibrated=1,453,910 | |||
| 100% | 99.9% | 1,453,910 | 1,452,119 |
| 90% | 89.8% | 1,308,519 | 1,305,957 |
| 80% | 79.9% | 1,163,128 | 1,162,261 |
| 70% | 70.0% | 1,017,737 | 1,017,311 |
| 60% | 59.7% | 872,346 | 868,401 |
| 50% | 50.1% | 726,955 | 728,169 |
| 40% | 39.9% | 581,564 | 580,698 |
| 30% | 30.2% | 436,173 | 438,593 |
| 20% | 20.0% | 290,782 | 290,937 |
| 10% | 9.9% | 145,391 | 144,235 |
| Active Idle | 0 | 0 | |
| Target Load | Actual Load | ssj_ops | |
|---|---|---|---|
| Target | Actual | ||
| Calibration 1 | 1,442,062 | ||
| Calibration 2 | 1,440,617 | ||
| Calibration 3 | 1,441,906 | ||
| ssj_ops@calibrated=1,441,262 | |||
| 100% | 99.8% | 1,441,262 | 1,438,083 |
| 90% | 90.0% | 1,297,136 | 1,296,914 |
| 80% | 80.1% | 1,153,009 | 1,154,159 |
| 70% | 70.1% | 1,008,883 | 1,010,689 |
| 60% | 60.1% | 864,757 | 866,142 |
| 50% | 50.3% | 720,631 | 724,401 |
| 40% | 40.1% | 576,505 | 577,526 |
| 30% | 29.9% | 432,379 | 431,102 |
| 20% | 19.9% | 288,252 | 286,748 |
| 10% | 10.0% | 144,126 | 144,312 |
| Active Idle | 0 | 0 | |
