SPECpower_ssj2008
Aggregate Performance Report
Copyright © 2007-2019 Standard Performance Evaluation Corporation
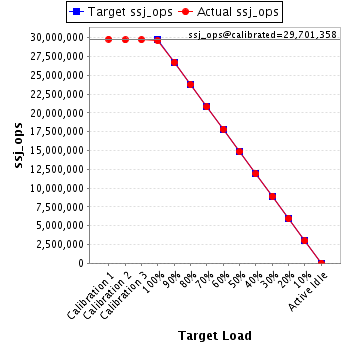
| Hewlett Packard Enterprise Synergy 480 Gen10 Compute Module | ssj_ops@100% = 29,610,404 ssj_ops@100% per Host = 5,922,081 ssj_ops@100% per JVM = 1,480,520 |
||||
| Test Sponsor: | Hewlett Packard Enterprise | SPEC License #: | 3 | Test Method: | Multi Node |
| Tested By: | Hewlett Packard Enterprise | Test Location: | Houston, TX, USA | Test Date: | Mar 12, 2019 |
| Hardware Availability: | Apr-2019 | Software Availability: | Mar-2019 | Publication: | Apr 2, 2019 |
| System Source: | Single Supplier | System Designation: | Server | Power Provisioning: | Line-powered |
| Target Load | Actual Load | ssj_ops | |
|---|---|---|---|
| Target | Actual | ||
| Calibration 1 | 29,798,054 | ||
| Calibration 2 | 29,694,182 | ||
| Calibration 3 | 29,708,535 | ||
| ssj_ops@calibrated=29,701,358 | |||
| 100% | 99.7% | 29,701,358 | 29,610,404 |
| 90% | 90.0% | 26,731,223 | 26,730,935 |
| 80% | 79.9% | 23,761,087 | 23,742,922 |
| 70% | 70.0% | 20,790,951 | 20,786,122 |
| 60% | 60.0% | 17,820,815 | 17,829,812 |
| 50% | 50.0% | 14,850,679 | 14,849,241 |
| 40% | 40.0% | 11,880,543 | 11,883,410 |
| 30% | 30.0% | 8,910,408 | 8,911,209 |
| 20% | 20.0% | 5,940,272 | 5,939,834 |
| 10% | 10.0% | 2,970,136 | 2,972,085 |
| Active Idle | 0 | 0 | |
| # of Nodes | # of Chips | # of Cores | # of Threads | Total RAM (GB) | # of OS Images | # of JVM Instances |
|---|---|---|---|---|---|---|
| 5 | 10 | 280 | 560 | 960 | 5 | 20 |
| Set Identifier: | SUT |
| Set Description: | System Under Test |
| # of Identical Nodes: | 5 |
| Comment: | SUT |
| Hardware per Node | |
|---|---|
| Hardware Vendor: | Hewlett Packard Enterprise |
| Model: | Synergy 480 Gen10 Compute Module |
| Form Factor: | blade |
| CPU Name: | Intel Xeon Platinum 8280 @ 2.70GHz |
| CPU Characteristics: | 28-Core, 2.70 GHz, 38.5MB L3 Cache |
| CPU Frequency (MHz): | 2700 |
| CPU(s) Enabled: | 56 cores, 2 chips, 28 cores/chip |
| Hardware Threads: | 112 (2 / core) |
| CPU(s) Orderable: | 1,2 chips |
| Primary Cache: | 32 KB I + 32 KB D on chip per core |
| Secondary Cache: | 1 MB I+D on chip per core |
| Tertiary Cache: | 39424 KB I+D on chip per chip |
| Other Cache: | None |
| Memory Amount (GB): | 192 |
| # and size of DIMM: | 12 x 16384 MB |
| Memory Details: | 12 x 16GB 2Rx8 PC4-2933Y-R; slots 1, 3, 5, 8, 10 and 12 populated on each socket |
| Power Supply Quantity and Rating (W): | None |
| Power Supply Details: | N/A |
| Disk Drive: | 1 x HPE 480GB SATA 6G M.2 2280 (875498-B21) |
| Disk Controller: | HPE Smart Array S100i SR Gen10 |
| # and type of Network Interface Cards (NICs) Installed: | 1 x HPE Synergy 3820C 10/20Gb CNA |
| NICs Enabled in Firmware / OS / Connected: | 2/2/1 |
| Network Speed (Mbit): | 1000 |
| Keyboard: | None |
| Mouse: | None |
| Monitor: | None |
| Optical Drives: | No |
| Other Hardware: | None |
| Software per Node | |
|---|---|
| Power Management: | Enabled (see SUT Notes) |
| Operating System (OS): | SUSE Linux Enterprise Server 12 SP4 |
| OS Version: | 4.12.14-94.41-default |
| Filesystem: | xfs |
| JVM Vendor: | Oracle Corporation |
| JVM Version: | Oracle Java HotSpot(TM) 64-Bit Server VM (build 24.80-b11, mixed mode), version 1.7.0_80 |
| JVM Command-line Options: | -server -Xmn19g -Xms21g -Xmx21g -XX:SurvivorRatio=1 -XX:TargetSurvivorRatio=99 -XX:AllocatePrefetchDistance=384 -XX:AllocatePrefetchLines=4 -XX:LoopUnrollLimit=37 -XX:InitialTenuringThreshold=12 -XX:MaxTenuringThreshold=15 -XX:ParallelGCThreads=28 -XX:InlineSmallCode=3900 -XX:MaxInlineSize=270 -XX:FreqInlineSize=2500 -XX:+AggressiveOpts -XX:+UseLargePages -XX:+UseParallelOldGC |
| JVM Affinity: | numactl --cpunodebind=[0-3] --localalloc |
| JVM Instances: | 4 |
| JVM Initial Heap (MB): | 21000 |
| JVM Maximum Heap (MB): | 21000 |
| JVM Address Bits: | 64 |
| Boot Firmware Version: | I42 v2.00 (02/02/2019) |
| Management Firmware Version: | 1.40 Feb 05 2019 |
| Workload Version: | SSJ 1.2.10 |
| Director Location: | Controller |
| Other Software: | HPE Service Pack for ProLiant (SPP) - Version 2019.03.0 (Mar 2019) |
| Host | ssj_ops@100% |
|---|---|
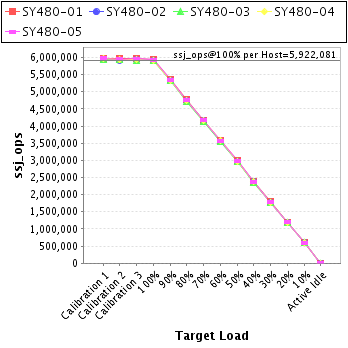
| SY480-01 | 5,943,642 |
| SY480-02 | 5,916,591 |
| SY480-03 | 5,896,368 |
| SY480-04 | 5,920,263 |
| SY480-05 | 5,933,541 |
| ssj_ops@100% | 29,610,404 |
| ssj_ops@100% per Host | 5,922,081 |
| ssj_ops@100% per JVM | 1,480,520 |
| Target Load | Actual Load | ssj_ops | |
|---|---|---|---|
| Target | Actual | ||
| Calibration 1 | 5,977,944 | ||
| Calibration 2 | 5,955,457 | ||
| Calibration 3 | 5,967,794 | ||
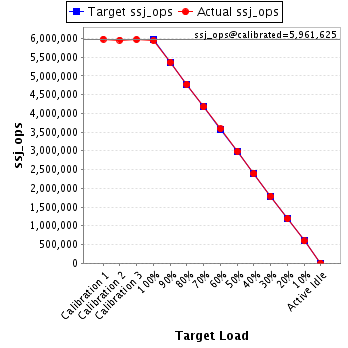
| ssj_ops@calibrated=5,961,625 | |||
| 100% | 99.7% | 5,961,625 | 5,943,642 |
| 90% | 90.0% | 5,365,463 | 5,365,379 |
| 80% | 80.1% | 4,769,300 | 4,772,345 |
| 70% | 70.0% | 4,173,138 | 4,171,810 |
| 60% | 60.1% | 3,576,975 | 3,584,017 |
| 50% | 50.1% | 2,980,813 | 2,984,598 |
| 40% | 40.0% | 2,384,650 | 2,386,477 |
| 30% | 30.1% | 1,788,488 | 1,793,576 |
| 20% | 20.0% | 1,192,325 | 1,190,798 |
| 10% | 10.0% | 596,163 | 594,973 |
| Active Idle | 0 | 0 | |
| Target Load | Actual Load | ssj_ops | |
|---|---|---|---|
| Target | Actual | ||
| Calibration 1 | 5,953,565 | ||
| Calibration 2 | 5,921,946 | ||
| Calibration 3 | 5,934,315 | ||
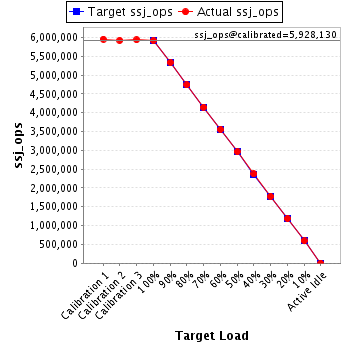
| ssj_ops@calibrated=5,928,130 | |||
| 100% | 99.8% | 5,928,130 | 5,916,591 |
| 90% | 90.0% | 5,335,317 | 5,337,377 |
| 80% | 79.9% | 4,742,504 | 4,738,918 |
| 70% | 70.0% | 4,149,691 | 4,148,084 |
| 60% | 60.0% | 3,556,878 | 3,558,210 |
| 50% | 50.0% | 2,964,065 | 2,962,155 |
| 40% | 40.0% | 2,371,252 | 2,371,945 |
| 30% | 30.0% | 1,778,439 | 1,776,822 |
| 20% | 20.0% | 1,185,626 | 1,187,167 |
| 10% | 10.0% | 592,813 | 594,824 |
| Active Idle | 0 | 0 | |
| Target Load | Actual Load | ssj_ops | |
|---|---|---|---|
| Target | Actual | ||
| Calibration 1 | 5,935,279 | ||
| Calibration 2 | 5,928,649 | ||
| Calibration 3 | 5,913,581 | ||
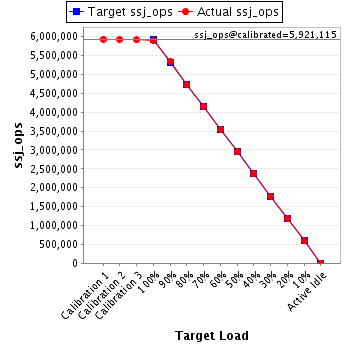
| ssj_ops@calibrated=5,921,115 | |||
| 100% | 99.6% | 5,921,115 | 5,896,368 |
| 90% | 90.2% | 5,329,003 | 5,339,790 |
| 80% | 79.9% | 4,736,892 | 4,729,415 |
| 70% | 70.0% | 4,144,780 | 4,144,234 |
| 60% | 59.9% | 3,552,669 | 3,549,331 |
| 50% | 49.9% | 2,960,557 | 2,953,706 |
| 40% | 40.0% | 2,368,446 | 2,368,123 |
| 30% | 30.0% | 1,776,334 | 1,777,807 |
| 20% | 20.0% | 1,184,223 | 1,184,084 |
| 10% | 10.0% | 592,111 | 593,177 |
| Active Idle | 0 | 0 | |
| Target Load | Actual Load | ssj_ops | |
|---|---|---|---|
| Target | Actual | ||
| Calibration 1 | 5,959,023 | ||
| Calibration 2 | 5,938,534 | ||
| Calibration 3 | 5,937,981 | ||
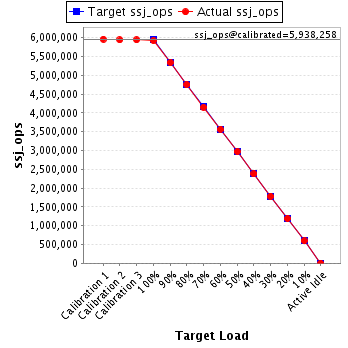
| ssj_ops@calibrated=5,938,258 | |||
| 100% | 99.7% | 5,938,258 | 5,920,263 |
| 90% | 89.9% | 5,344,432 | 5,338,905 |
| 80% | 80.0% | 4,750,606 | 4,749,369 |
| 70% | 69.9% | 4,156,780 | 4,152,416 |
| 60% | 60.0% | 3,562,955 | 3,565,617 |
| 50% | 50.0% | 2,969,129 | 2,967,550 |
| 40% | 40.0% | 2,375,303 | 2,374,764 |
| 30% | 30.0% | 1,781,477 | 1,780,713 |
| 20% | 20.0% | 1,187,652 | 1,187,116 |
| 10% | 10.0% | 593,826 | 594,757 |
| Active Idle | 0 | 0 | |
| Target Load | Actual Load | ssj_ops | |
|---|---|---|---|
| Target | Actual | ||
| Calibration 1 | 5,972,244 | ||
| Calibration 2 | 5,949,596 | ||
| Calibration 3 | 5,954,865 | ||
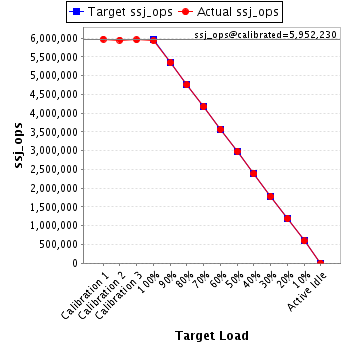
| ssj_ops@calibrated=5,952,230 | |||
| 100% | 99.7% | 5,952,230 | 5,933,541 |
| 90% | 89.9% | 5,357,007 | 5,349,484 |
| 80% | 79.9% | 4,761,784 | 4,752,875 |
| 70% | 70.1% | 4,166,561 | 4,169,579 |
| 60% | 60.0% | 3,571,338 | 3,572,637 |
| 50% | 50.1% | 2,976,115 | 2,981,231 |
| 40% | 40.0% | 2,380,892 | 2,382,101 |
| 30% | 29.9% | 1,785,669 | 1,782,291 |
| 20% | 20.0% | 1,190,446 | 1,190,668 |
| 10% | 10.0% | 595,223 | 594,353 |
| Active Idle | 0 | 0 | |