
SPECpower_ssj2008
Host 'Node04' Performance Report
Copyright © 2007-2018 Standard Performance Evaluation Corporation
| Hewlett Packard Enterprise Synergy 660 Gen10 Compute Module | ssj_ops@100% = 11,546,436 ssj_ops@100% per JVM = 1,443,304 |
||||
| Test Sponsor: | Hewlett Packard Enterprise | SPEC License #: | 3 | Test Method: | Multi Node |
| Tested By: | Hewlett Packard Enterprise | Test Location: | Houston, TX, USA | Test Date: | Aug 27, 2018 |
| Hardware Availability: | Jun-2018 | Software Availability: | Mar-2018 | Publication: | Sep 12, 2018 |
| System Source: | Single Supplier | System Designation: | Server | Power Provisioning: | Line-powered |
| Target Load | Actual Load | ssj_ops | |
|---|---|---|---|
| Target | Actual | ||
| Calibration 1 | 11,555,241 | ||
| Calibration 2 | 11,560,581 | ||
| Calibration 3 | 11,579,728 | ||
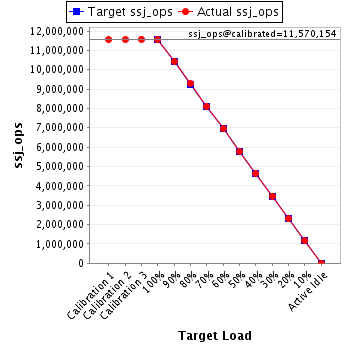
| ssj_ops@calibrated=11,570,154 | |||
| 100% | 99.8% | 11,570,154 | 11,546,436 |
| 90% | 90.1% | 10,413,139 | 10,422,073 |
| 80% | 80.4% | 9,256,123 | 9,297,052 |
| 70% | 70.0% | 8,099,108 | 8,101,503 |
| 60% | 60.1% | 6,942,093 | 6,958,612 |
| 50% | 50.0% | 5,785,077 | 5,781,624 |
| 40% | 40.1% | 4,628,062 | 4,634,296 |
| 30% | 30.0% | 3,471,046 | 3,473,092 |
| 20% | 20.0% | 2,314,031 | 2,313,769 |
| 10% | 10.0% | 1,157,015 | 1,153,800 |
| Active Idle | 0 | 0 | |
| Set Identifier: | SUT |
| Set Description: | System Under Test |
| # of Identical Nodes: | 4 |
| Comment: | SUT |
| Hardware | |
|---|---|
| Hardware Vendor: | Hewlett Packard Enterprise |
| Model: | Synergy 660 Gen10 Compute Module |
| Form Factor: | Other |
| CPU Name: | Intel Xeon Platinum 8180 2.50GHz |
| CPU Characteristics: | 28-Core, 2.50 GHz, 38.5MB L3 Cache |
| CPU Frequency (MHz): | 2500 |
| CPU(s) Enabled: | 112 cores, 4 chips, 28 cores/chip |
| Hardware Threads: | 224 (2 / core) |
| CPU(s) Orderable: | 1,2,3,4 chips |
| Primary Cache: | 32 KB I + 32 KB D on chip per core |
| Secondary Cache: | 1 MB I+D on chip per core |
| Tertiary Cache: | 39424 KB I+D on chip per chip |
| Other Cache: | None |
| Memory Amount (GB): | 384 |
| # and size of DIMM: | 24 x 16384 MB |
| Memory Details: | 24 x 16GB 2Rx8 PC4-2666-V ECC; slots 1, 3, 5, 8, 10 and 12 populated on each CPU socket |
| Power Supply Quantity and Rating (W): | None |
| Power Supply Details: | Shared |
| Disk Drive: | 1 x HPE 480GB SATA 6G Read Intensive M.2 (875319-B21) |
| Disk Controller: | 1 x HPE Smart Array S100i SR Gen10 (784308-B21) |
| # and type of Network Interface Cards (NICs) Installed: | 1 x HPE Synergy 3820C 10/20Gb 2-port Converged Network Adapter (777430-B21) |
| NICs Enabled in Firmware / OS / Connected: | 2/1/1 |
| Network Speed (Mbit): | 10000 |
| Keyboard: | None |
| Mouse: | None |
| Monitor: | None |
| Optical Drives: | No |
| Other Hardware: | None |
| Software | |
|---|---|
| Power Management: | Enabled (see SUT Notes) |
| Operating System (OS): | Windows Server 2012 R2 Datacenter |
| OS Version: | Version 6.3 (Build 9600) |
| Filesystem: | NTFS |
| JVM Vendor: | Oracle Corporation |
| JVM Version: | Oracle Java HotSpot(TM) 64-Bit Server VM (build 24.80-b11, mixed mode), version 1.7.0_80 |
| JVM Command-line Options: | -server -Xmn19g -Xms21g -Xmx21g -XX:SurvivorRatio=1 -XX:TargetSurvivorRatio=99 -XX:AllocatePrefetchDistance=256 -XX:AllocatePrefetchLines=4 -XX:LoopUnrollLimit=30 -XX:InitialTenuringThreshold=12 -XX:MaxTenuringThreshold=15 -XX:ParallelGCThreads=28 -XX:InlineSmallCode=3900 -XX:MaxInlineSize=270 -XX:FreqInlineSize=2500 -XX:+AggressiveOpts -XX:+UseLargePages -XX:+UseParallelOldGC |
| JVM Affinity: | start /NODE [0,2,4,6] /AFFINITY [0x0000000FC0FF, 0xFC0FF0000000]; start /NODE [1,3,5,7] /AFFINITY [0x0000000FF03F,0xFF03F0000000] |
| JVM Instances: | 8 |
| JVM Initial Heap (MB): | 21000 |
| JVM Maximum Heap (MB): | 21000 |
| JVM Address Bits: | 64 |
| Boot Firmware Version: | I43 v1.32 (02/01/2018) |
| Management Firmware Version: | 1.15 August 17 2017 |
| Workload Version: | SSJ 1.2.10 |
| Director Location: | Controller |
| Other Software: | HPE Composer Version 3.10.07 (HPE OneView) with HPE Synergy Custom SPP Bundle 2017.10.20180323; Microsoft Windows KB4054519, KB4056898 |
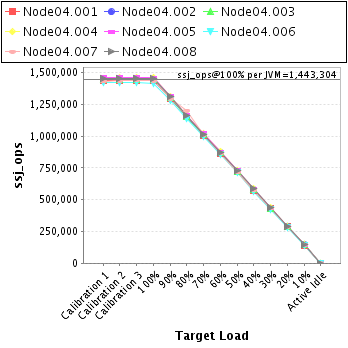
| JVM Instance | ssj_ops@100% |
|---|---|
| Node04.001 | 1,434,699 |
| Node04.002 | 1,441,295 |
| Node04.003 | 1,445,706 |
| Node04.004 | 1,459,079 |
| Node04.005 | 1,459,727 |
| Node04.006 | 1,418,021 |
| Node04.007 | 1,436,790 |
| Node04.008 | 1,451,119 |
| ssj_ops@100% | 11,546,436 |
| ssj_ops@100% per JVM | 1,443,304 |
| Target Load | Actual Load | ssj_ops | |
|---|---|---|---|
| Target | Actual | ||
| Calibration 1 | 1,439,769 | ||
| Calibration 2 | 1,437,564 | ||
| Calibration 3 | 1,441,108 | ||
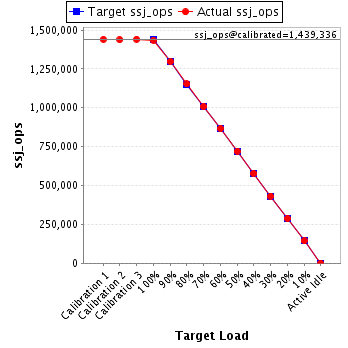
| ssj_ops@calibrated=1,439,336 | |||
| 100% | 99.7% | 1,439,336 | 1,434,699 |
| 90% | 90.2% | 1,295,402 | 1,297,686 |
| 80% | 80.1% | 1,151,469 | 1,153,180 |
| 70% | 70.1% | 1,007,535 | 1,008,510 |
| 60% | 60.1% | 863,602 | 865,634 |
| 50% | 50.1% | 719,668 | 721,067 |
| 40% | 40.0% | 575,734 | 576,072 |
| 30% | 30.0% | 431,801 | 432,382 |
| 20% | 20.1% | 287,867 | 288,990 |
| 10% | 10.0% | 143,934 | 143,612 |
| Active Idle | 0 | 0 | |
| Target Load | Actual Load | ssj_ops | |
|---|---|---|---|
| Target | Actual | ||
| Calibration 1 | 1,444,838 | ||
| Calibration 2 | 1,444,532 | ||
| Calibration 3 | 1,446,592 | ||
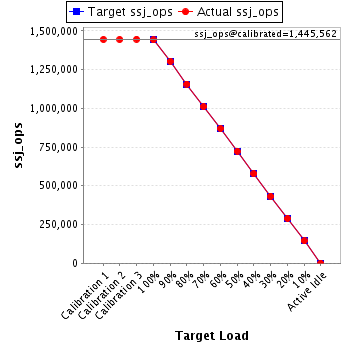
| ssj_ops@calibrated=1,445,562 | |||
| 100% | 99.7% | 1,445,562 | 1,441,295 |
| 90% | 90.2% | 1,301,006 | 1,303,939 |
| 80% | 80.0% | 1,156,449 | 1,156,877 |
| 70% | 69.9% | 1,011,893 | 1,011,000 |
| 60% | 60.1% | 867,337 | 869,319 |
| 50% | 50.1% | 722,781 | 723,552 |
| 40% | 39.9% | 578,225 | 577,187 |
| 30% | 30.0% | 433,669 | 433,166 |
| 20% | 20.0% | 289,112 | 288,774 |
| 10% | 10.0% | 144,556 | 144,147 |
| Active Idle | 0 | 0 | |
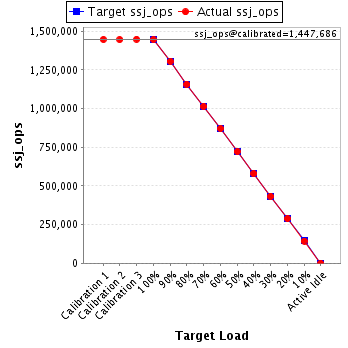
| Target Load | Actual Load | ssj_ops | |
|---|---|---|---|
| Target | Actual | ||
| Calibration 1 | 1,447,255 | ||
| Calibration 2 | 1,446,328 | ||
| Calibration 3 | 1,449,045 | ||
| ssj_ops@calibrated=1,447,686 | |||
| 100% | 99.9% | 1,447,686 | 1,445,706 |
| 90% | 90.2% | 1,302,918 | 1,306,098 |
| 80% | 79.9% | 1,158,149 | 1,157,238 |
| 70% | 70.1% | 1,013,380 | 1,015,228 |
| 60% | 60.1% | 868,612 | 870,367 |
| 50% | 49.8% | 723,843 | 721,648 |
| 40% | 40.0% | 579,075 | 579,129 |
| 30% | 30.0% | 434,306 | 433,635 |
| 20% | 19.9% | 289,537 | 288,161 |
| 10% | 9.9% | 144,769 | 143,723 |
| Active Idle | 0 | 0 | |
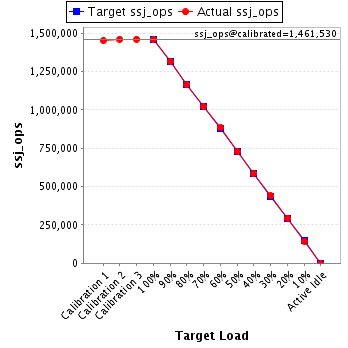
| Target Load | Actual Load | ssj_ops | |
|---|---|---|---|
| Target | Actual | ||
| Calibration 1 | 1,453,397 | ||
| Calibration 2 | 1,461,133 | ||
| Calibration 3 | 1,461,927 | ||
| ssj_ops@calibrated=1,461,530 | |||
| 100% | 99.8% | 1,461,530 | 1,459,079 |
| 90% | 90.0% | 1,315,377 | 1,315,045 |
| 80% | 79.8% | 1,169,224 | 1,165,961 |
| 70% | 69.9% | 1,023,071 | 1,022,272 |
| 60% | 60.4% | 876,918 | 883,027 |
| 50% | 49.9% | 730,765 | 729,394 |
| 40% | 40.1% | 584,612 | 585,578 |
| 30% | 30.2% | 438,459 | 441,434 |
| 20% | 20.0% | 292,306 | 291,941 |
| 10% | 9.9% | 146,153 | 144,672 |
| Active Idle | 0 | 0 | |
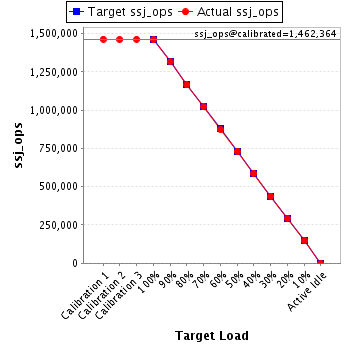
| Target Load | Actual Load | ssj_ops | |
|---|---|---|---|
| Target | Actual | ||
| Calibration 1 | 1,463,802 | ||
| Calibration 2 | 1,461,627 | ||
| Calibration 3 | 1,463,101 | ||
| ssj_ops@calibrated=1,462,364 | |||
| 100% | 99.8% | 1,462,364 | 1,459,727 |
| 90% | 89.9% | 1,316,128 | 1,315,202 |
| 80% | 79.7% | 1,169,891 | 1,165,637 |
| 70% | 69.9% | 1,023,655 | 1,022,048 |
| 60% | 59.9% | 877,418 | 876,502 |
| 50% | 50.0% | 731,182 | 731,025 |
| 40% | 40.2% | 584,946 | 587,372 |
| 30% | 30.0% | 438,709 | 438,228 |
| 20% | 20.0% | 292,473 | 292,991 |
| 10% | 10.1% | 146,236 | 147,018 |
| Active Idle | 0 | 0 | |
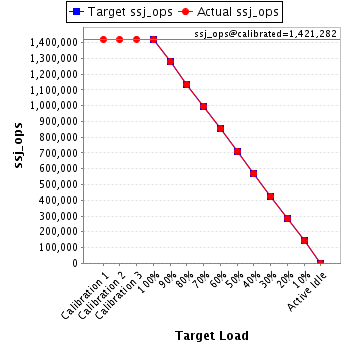
| Target Load | Actual Load | ssj_ops | |
|---|---|---|---|
| Target | Actual | ||
| Calibration 1 | 1,420,327 | ||
| Calibration 2 | 1,419,989 | ||
| Calibration 3 | 1,422,575 | ||
| ssj_ops@calibrated=1,421,282 | |||
| 100% | 99.8% | 1,421,282 | 1,418,021 |
| 90% | 89.9% | 1,279,154 | 1,278,230 |
| 80% | 79.9% | 1,137,026 | 1,135,152 |
| 70% | 70.1% | 994,897 | 996,279 |
| 60% | 60.2% | 852,769 | 855,329 |
| 50% | 50.1% | 710,641 | 712,473 |
| 40% | 40.0% | 568,513 | 568,037 |
| 30% | 30.0% | 426,385 | 425,937 |
| 20% | 20.0% | 284,256 | 283,642 |
| 10% | 9.9% | 142,128 | 141,385 |
| Active Idle | 0 | 0 | |
| Target Load | Actual Load | ssj_ops | |
|---|---|---|---|
| Target | Actual | ||
| Calibration 1 | 1,431,431 | ||
| Calibration 2 | 1,436,526 | ||
| Calibration 3 | 1,440,265 | ||
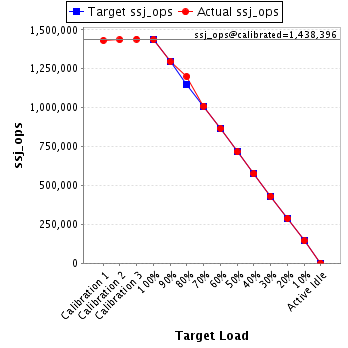
| ssj_ops@calibrated=1,438,396 | |||
| 100% | 99.9% | 1,438,396 | 1,436,790 |
| 90% | 90.1% | 1,294,556 | 1,295,319 |
| 80% | 83.5% | 1,150,716 | 1,200,393 |
| 70% | 70.3% | 1,006,877 | 1,010,486 |
| 60% | 60.2% | 863,037 | 865,841 |
| 50% | 49.8% | 719,198 | 715,763 |
| 40% | 40.0% | 575,358 | 574,771 |
| 30% | 30.0% | 431,519 | 431,619 |
| 20% | 20.0% | 287,679 | 288,082 |
| 10% | 10.1% | 143,840 | 144,678 |
| Active Idle | 0 | 0 | |
| Target Load | Actual Load | ssj_ops | |
|---|---|---|---|
| Target | Actual | ||
| Calibration 1 | 1,454,422 | ||
| Calibration 2 | 1,452,882 | ||
| Calibration 3 | 1,455,115 | ||
| ssj_ops@calibrated=1,453,999 | |||
| 100% | 99.8% | 1,453,999 | 1,451,119 |
| 90% | 90.1% | 1,308,599 | 1,310,554 |
| 80% | 80.0% | 1,163,199 | 1,162,614 |
| 70% | 69.9% | 1,017,799 | 1,015,680 |
| 60% | 60.0% | 872,399 | 872,592 |
| 50% | 50.0% | 726,999 | 726,701 |
| 40% | 40.3% | 581,599 | 586,152 |
| 30% | 30.0% | 436,200 | 436,690 |
| 20% | 20.0% | 290,800 | 291,188 |
| 10% | 9.9% | 145,400 | 144,565 |
| Active Idle | 0 | 0 | |
