SPECpower_ssj2008
Host 'Node03' Performance Report
Copyright © 2007-2018 Standard Performance Evaluation Corporation
| Hewlett Packard Enterprise Synergy 660 Gen10 Compute Module | ssj_ops@100% = 11,497,048 ssj_ops@100% per JVM = 1,437,131 |
||||
| Test Sponsor: | Hewlett Packard Enterprise | SPEC License #: | 3 | Test Method: | Multi Node |
| Tested By: | Hewlett Packard Enterprise | Test Location: | Houston, TX, USA | Test Date: | Aug 27, 2018 |
| Hardware Availability: | Jun-2018 | Software Availability: | Mar-2018 | Publication: | Sep 12, 2018 |
| System Source: | Single Supplier | System Designation: | Server | Power Provisioning: | Line-powered |
| Target Load | Actual Load | ssj_ops | |
|---|---|---|---|
| Target | Actual | ||
| Calibration 1 | 11,536,967 | ||
| Calibration 2 | 11,514,375 | ||
| Calibration 3 | 11,526,953 | ||
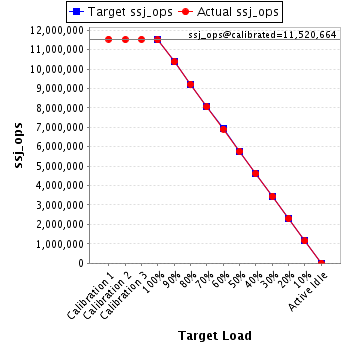
| ssj_ops@calibrated=11,520,664 | |||
| 100% | 99.8% | 11,520,664 | 11,497,048 |
| 90% | 90.0% | 10,368,597 | 10,373,981 |
| 80% | 80.1% | 9,216,531 | 9,223,085 |
| 70% | 69.9% | 8,064,465 | 8,047,305 |
| 60% | 60.0% | 6,912,398 | 6,910,584 |
| 50% | 50.1% | 5,760,332 | 5,766,337 |
| 40% | 40.0% | 4,608,266 | 4,611,946 |
| 30% | 30.0% | 3,456,199 | 3,452,881 |
| 20% | 20.0% | 2,304,133 | 2,305,939 |
| 10% | 10.0% | 1,152,066 | 1,147,004 |
| Active Idle | 0 | 0 | |
| Set Identifier: | SUT |
| Set Description: | System Under Test |
| # of Identical Nodes: | 4 |
| Comment: | SUT |
| Hardware | |
|---|---|
| Hardware Vendor: | Hewlett Packard Enterprise |
| Model: | Synergy 660 Gen10 Compute Module |
| Form Factor: | Other |
| CPU Name: | Intel Xeon Platinum 8180 2.50GHz |
| CPU Characteristics: | 28-Core, 2.50 GHz, 38.5MB L3 Cache |
| CPU Frequency (MHz): | 2500 |
| CPU(s) Enabled: | 112 cores, 4 chips, 28 cores/chip |
| Hardware Threads: | 224 (2 / core) |
| CPU(s) Orderable: | 1,2,3,4 chips |
| Primary Cache: | 32 KB I + 32 KB D on chip per core |
| Secondary Cache: | 1 MB I+D on chip per core |
| Tertiary Cache: | 39424 KB I+D on chip per chip |
| Other Cache: | None |
| Memory Amount (GB): | 384 |
| # and size of DIMM: | 24 x 16384 MB |
| Memory Details: | 24 x 16GB 2Rx8 PC4-2666-V ECC; slots 1, 3, 5, 8, 10 and 12 populated on each CPU socket |
| Power Supply Quantity and Rating (W): | None |
| Power Supply Details: | Shared |
| Disk Drive: | 1 x HPE 480GB SATA 6G Read Intensive M.2 (875319-B21) |
| Disk Controller: | 1 x HPE Smart Array S100i SR Gen10 (784308-B21) |
| # and type of Network Interface Cards (NICs) Installed: | 1 x HPE Synergy 3820C 10/20Gb 2-port Converged Network Adapter (777430-B21) |
| NICs Enabled in Firmware / OS / Connected: | 2/1/1 |
| Network Speed (Mbit): | 10000 |
| Keyboard: | None |
| Mouse: | None |
| Monitor: | None |
| Optical Drives: | No |
| Other Hardware: | None |
| Software | |
|---|---|
| Power Management: | Enabled (see SUT Notes) |
| Operating System (OS): | Windows Server 2012 R2 Datacenter |
| OS Version: | Version 6.3 (Build 9600) |
| Filesystem: | NTFS |
| JVM Vendor: | Oracle Corporation |
| JVM Version: | Oracle Java HotSpot(TM) 64-Bit Server VM (build 24.80-b11, mixed mode), version 1.7.0_80 |
| JVM Command-line Options: | -server -Xmn19g -Xms21g -Xmx21g -XX:SurvivorRatio=1 -XX:TargetSurvivorRatio=99 -XX:AllocatePrefetchDistance=256 -XX:AllocatePrefetchLines=4 -XX:LoopUnrollLimit=30 -XX:InitialTenuringThreshold=12 -XX:MaxTenuringThreshold=15 -XX:ParallelGCThreads=28 -XX:InlineSmallCode=3900 -XX:MaxInlineSize=270 -XX:FreqInlineSize=2500 -XX:+AggressiveOpts -XX:+UseLargePages -XX:+UseParallelOldGC |
| JVM Affinity: | start /NODE [0,2,4,6] /AFFINITY [0x0000000FC0FF, 0xFC0FF0000000]; start /NODE [1,3,5,7] /AFFINITY [0x0000000FF03F,0xFF03F0000000] |
| JVM Instances: | 8 |
| JVM Initial Heap (MB): | 21000 |
| JVM Maximum Heap (MB): | 21000 |
| JVM Address Bits: | 64 |
| Boot Firmware Version: | I43 v1.32 (02/01/2018) |
| Management Firmware Version: | 1.15 August 17 2017 |
| Workload Version: | SSJ 1.2.10 |
| Director Location: | Controller |
| Other Software: | HPE Composer Version 3.10.07 (HPE OneView) with HPE Synergy Custom SPP Bundle 2017.10.20180323; Microsoft Windows KB4054519, KB4056898 |
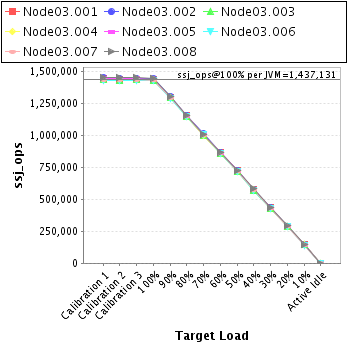
| JVM Instance | ssj_ops@100% |
|---|---|
| Node03.001 | 1,438,205 |
| Node03.002 | 1,441,701 |
| Node03.003 | 1,432,217 |
| Node03.004 | 1,436,710 |
| Node03.005 | 1,438,287 |
| Node03.006 | 1,428,576 |
| Node03.007 | 1,432,418 |
| Node03.008 | 1,448,934 |
| ssj_ops@100% | 11,497,048 |
| ssj_ops@100% per JVM | 1,437,131 |
| Target Load | Actual Load | ssj_ops | |
|---|---|---|---|
| Target | Actual | ||
| Calibration 1 | 1,442,210 | ||
| Calibration 2 | 1,439,429 | ||
| Calibration 3 | 1,441,287 | ||
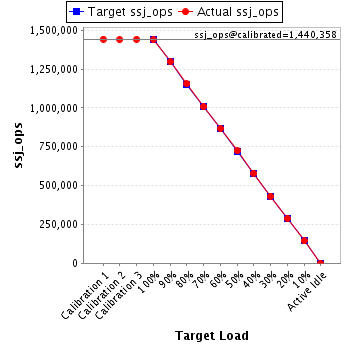
| ssj_ops@calibrated=1,440,358 | |||
| 100% | 99.9% | 1,440,358 | 1,438,205 |
| 90% | 90.0% | 1,296,322 | 1,296,074 |
| 80% | 80.2% | 1,152,287 | 1,155,301 |
| 70% | 70.0% | 1,008,251 | 1,007,771 |
| 60% | 60.2% | 864,215 | 866,644 |
| 50% | 50.2% | 720,179 | 723,529 |
| 40% | 40.2% | 576,143 | 579,643 |
| 30% | 30.0% | 432,107 | 432,439 |
| 20% | 20.0% | 288,072 | 288,562 |
| 10% | 9.9% | 144,036 | 143,300 |
| Active Idle | 0 | 0 | |
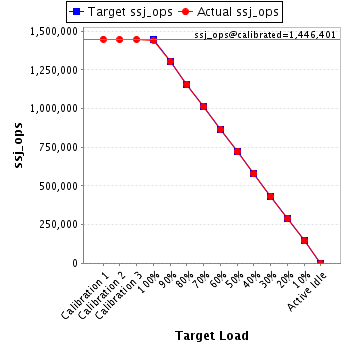
| Target Load | Actual Load | ssj_ops | |
|---|---|---|---|
| Target | Actual | ||
| Calibration 1 | 1,449,200 | ||
| Calibration 2 | 1,445,847 | ||
| Calibration 3 | 1,446,954 | ||
| ssj_ops@calibrated=1,446,401 | |||
| 100% | 99.7% | 1,446,401 | 1,441,701 |
| 90% | 90.2% | 1,301,760 | 1,304,189 |
| 80% | 80.1% | 1,157,120 | 1,158,108 |
| 70% | 69.9% | 1,012,480 | 1,011,567 |
| 60% | 59.9% | 867,840 | 866,004 |
| 50% | 50.0% | 723,200 | 722,801 |
| 40% | 39.9% | 578,560 | 577,591 |
| 30% | 29.9% | 433,920 | 432,846 |
| 20% | 20.0% | 289,280 | 288,860 |
| 10% | 10.0% | 144,640 | 144,145 |
| Active Idle | 0 | 0 | |
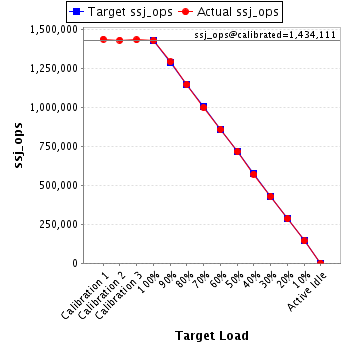
| Target Load | Actual Load | ssj_ops | |
|---|---|---|---|
| Target | Actual | ||
| Calibration 1 | 1,439,534 | ||
| Calibration 2 | 1,433,384 | ||
| Calibration 3 | 1,434,838 | ||
| ssj_ops@calibrated=1,434,111 | |||
| 100% | 99.9% | 1,434,111 | 1,432,217 |
| 90% | 90.2% | 1,290,700 | 1,293,562 |
| 80% | 80.1% | 1,147,289 | 1,148,663 |
| 70% | 69.8% | 1,003,878 | 1,000,365 |
| 60% | 59.9% | 860,466 | 859,100 |
| 50% | 50.0% | 717,055 | 717,255 |
| 40% | 39.9% | 573,644 | 572,283 |
| 30% | 30.0% | 430,233 | 429,846 |
| 20% | 19.9% | 286,822 | 285,547 |
| 10% | 10.0% | 143,411 | 143,668 |
| Active Idle | 0 | 0 | |
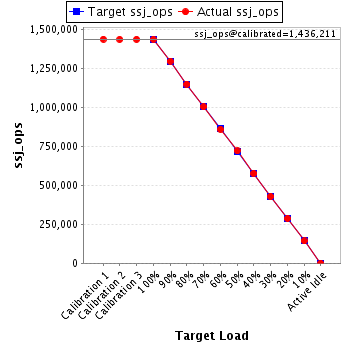
| Target Load | Actual Load | ssj_ops | |
|---|---|---|---|
| Target | Actual | ||
| Calibration 1 | 1,437,422 | ||
| Calibration 2 | 1,435,839 | ||
| Calibration 3 | 1,436,583 | ||
| ssj_ops@calibrated=1,436,211 | |||
| 100% | 100.0% | 1,436,211 | 1,436,710 |
| 90% | 90.3% | 1,292,590 | 1,296,248 |
| 80% | 80.0% | 1,148,969 | 1,149,380 |
| 70% | 69.8% | 1,005,348 | 1,002,745 |
| 60% | 59.9% | 861,727 | 859,698 |
| 50% | 50.1% | 718,105 | 720,185 |
| 40% | 40.1% | 574,484 | 575,433 |
| 30% | 29.8% | 430,863 | 428,441 |
| 20% | 20.0% | 287,242 | 287,376 |
| 10% | 9.9% | 143,621 | 142,883 |
| Active Idle | 0 | 0 | |
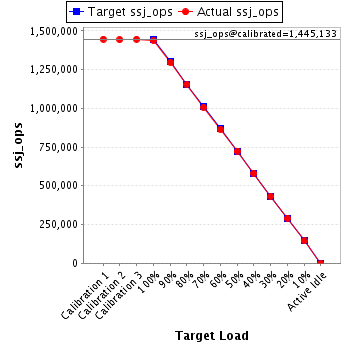
| Target Load | Actual Load | ssj_ops | |
|---|---|---|---|
| Target | Actual | ||
| Calibration 1 | 1,446,688 | ||
| Calibration 2 | 1,443,574 | ||
| Calibration 3 | 1,446,692 | ||
| ssj_ops@calibrated=1,445,133 | |||
| 100% | 99.5% | 1,445,133 | 1,438,287 |
| 90% | 89.8% | 1,300,620 | 1,297,634 |
| 80% | 80.0% | 1,156,106 | 1,155,739 |
| 70% | 69.7% | 1,011,593 | 1,007,839 |
| 60% | 59.9% | 867,080 | 866,054 |
| 50% | 50.1% | 722,566 | 724,039 |
| 40% | 40.2% | 578,053 | 580,479 |
| 30% | 29.9% | 433,540 | 432,803 |
| 20% | 20.0% | 289,027 | 289,466 |
| 10% | 10.0% | 144,513 | 144,429 |
| Active Idle | 0 | 0 | |
| Target Load | Actual Load | ssj_ops | |
|---|---|---|---|
| Target | Actual | ||
| Calibration 1 | 1,430,412 | ||
| Calibration 2 | 1,430,915 | ||
| Calibration 3 | 1,433,211 | ||
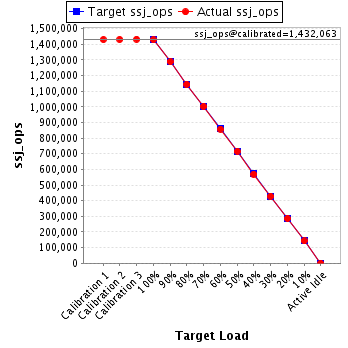
| ssj_ops@calibrated=1,432,063 | |||
| 100% | 99.8% | 1,432,063 | 1,428,576 |
| 90% | 90.0% | 1,288,857 | 1,288,626 |
| 80% | 79.9% | 1,145,650 | 1,144,195 |
| 70% | 70.1% | 1,002,444 | 1,004,458 |
| 60% | 59.9% | 859,238 | 858,496 |
| 50% | 50.0% | 716,031 | 716,079 |
| 40% | 39.8% | 572,825 | 569,794 |
| 30% | 30.0% | 429,619 | 429,695 |
| 20% | 20.0% | 286,413 | 286,313 |
| 10% | 10.0% | 143,206 | 142,618 |
| Active Idle | 0 | 0 | |
| Target Load | Actual Load | ssj_ops | |
|---|---|---|---|
| Target | Actual | ||
| Calibration 1 | 1,436,053 | ||
| Calibration 2 | 1,435,117 | ||
| Calibration 3 | 1,435,823 | ||
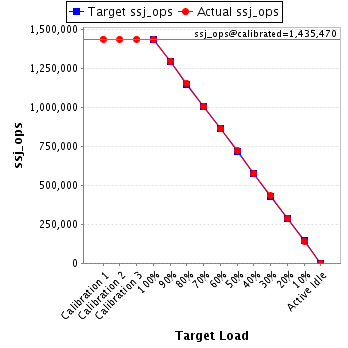
| ssj_ops@calibrated=1,435,470 | |||
| 100% | 99.8% | 1,435,470 | 1,432,418 |
| 90% | 90.2% | 1,291,923 | 1,295,233 |
| 80% | 80.3% | 1,148,376 | 1,152,444 |
| 70% | 69.9% | 1,004,829 | 1,002,742 |
| 60% | 60.2% | 861,282 | 864,535 |
| 50% | 50.1% | 717,735 | 719,692 |
| 40% | 40.0% | 574,188 | 574,366 |
| 30% | 30.1% | 430,641 | 432,132 |
| 20% | 20.1% | 287,094 | 288,235 |
| 10% | 9.9% | 143,547 | 142,417 |
| Active Idle | 0 | 0 | |
| Target Load | Actual Load | ssj_ops | |
|---|---|---|---|
| Target | Actual | ||
| Calibration 1 | 1,455,449 | ||
| Calibration 2 | 1,450,269 | ||
| Calibration 3 | 1,451,566 | ||
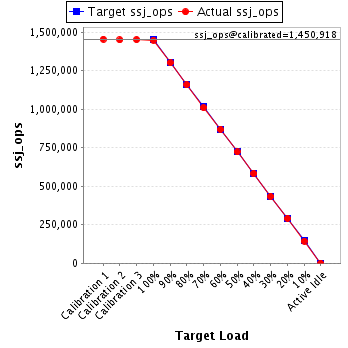
| ssj_ops@calibrated=1,450,918 | |||
| 100% | 99.9% | 1,450,918 | 1,448,934 |
| 90% | 89.8% | 1,305,826 | 1,302,416 |
| 80% | 79.9% | 1,160,734 | 1,159,254 |
| 70% | 69.6% | 1,015,642 | 1,009,820 |
| 60% | 60.0% | 870,551 | 870,054 |
| 50% | 49.8% | 725,459 | 722,756 |
| 40% | 40.1% | 580,367 | 582,357 |
| 30% | 30.0% | 435,275 | 434,679 |
| 20% | 20.1% | 290,184 | 291,579 |
| 10% | 9.9% | 145,092 | 143,544 |
| Active Idle | 0 | 0 | |