SPECpower_ssj2008
Host 'NODE05' Performance Report
Copyright © 2007-2018 Standard Performance Evaluation Corporation
| Hewlett Packard Enterprise Synergy 480 Gen10 Compute Module | ssj_ops@100% = 5,689,156 ssj_ops@100% per JVM = 1,422,289 |
||||
| Test Sponsor: | Hewlett Packard Enterprise | SPEC License #: | 3 | Test Method: | Multi Node |
| Tested By: | Hewlett Packard Enterprise | Test Location: | Houston, TX, USA | Test Date: | Aug 26, 2018 |
| Hardware Availability: | Jun-2018 | Software Availability: | Mar-2018 | Publication: | Sep 12, 2018 |
| System Source: | Single Supplier | System Designation: | Server | Power Provisioning: | Line-powered |
| Target Load | Actual Load | ssj_ops | |
|---|---|---|---|
| Target | Actual | ||
| Calibration 1 | 5,703,488 | ||
| Calibration 2 | 5,703,471 | ||
| Calibration 3 | 5,714,350 | ||
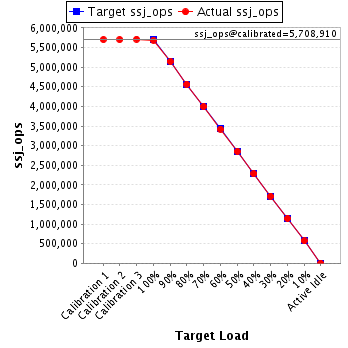
| ssj_ops@calibrated=5,708,910 | |||
| 100% | 99.7% | 5,708,910 | 5,689,156 |
| 90% | 90.1% | 5,138,019 | 5,144,376 |
| 80% | 80.0% | 4,567,128 | 4,565,254 |
| 70% | 70.0% | 3,996,237 | 3,996,502 |
| 60% | 59.9% | 3,425,346 | 3,422,204 |
| 50% | 50.0% | 2,854,455 | 2,852,553 |
| 40% | 39.9% | 2,283,564 | 2,280,367 |
| 30% | 30.0% | 1,712,673 | 1,711,251 |
| 20% | 20.0% | 1,141,782 | 1,141,350 |
| 10% | 10.0% | 570,891 | 571,776 |
| Active Idle | 0 | 0 | |
| Set Identifier: | SUT |
| Set Description: | System Under Test |
| # of Identical Nodes: | 7 |
| Comment: | SUT |
| Hardware | |
|---|---|
| Hardware Vendor: | Hewlett Packard Enterprise |
| Model: | Synergy 480 Gen10 Compute Module |
| Form Factor: | Other |
| CPU Name: | Intel Xeon Platinum 8180 2.50GHz |
| CPU Characteristics: | 28-Core, 2.50 GHz, 38.5 MB L3 Cache |
| CPU Frequency (MHz): | 2500 |
| CPU(s) Enabled: | 56 cores, 2 chips, 28 cores/chip |
| Hardware Threads: | 112 (2 / core) |
| CPU(s) Orderable: | 1,2 chips |
| Primary Cache: | 32 KB I + 32 KB D on chip per core |
| Secondary Cache: | 1 MB I+D on chip per core |
| Tertiary Cache: | 39424 KB I+D on chip per chip |
| Other Cache: | None |
| Memory Amount (GB): | 192 |
| # and size of DIMM: | 12 x 16384 MB |
| Memory Details: | 12 x 16GB 2Rx8 PC4-2666-V ECC; slots 1, 3, 5, 8, 10 and 12 populated on each CPU socket |
| Power Supply Quantity and Rating (W): | None |
| Power Supply Details: | Shared |
| Disk Drive: | 1 x HPE Synergy 480 Gen10 M.2 FIO Adapter Board Kit (873165-B21); 1 x HPE 480GB SATA 6G Read Intensive M.2 2280 SSD (875498-B21) |
| Disk Controller: | 1 x HPE Smart Array S100i SR Gen10 |
| # and type of Network Interface Cards (NICs) Installed: | 1 x HPE Synergy 3820C 10/20Gb 2-port Converged Network Adapter (777430-B21) |
| NICs Enabled in Firmware / OS / Connected: | 2/1/1 |
| Network Speed (Mbit): | 10000 |
| Keyboard: | None |
| Mouse: | None |
| Monitor: | None |
| Optical Drives: | No |
| Other Hardware: | None |
| Software | |
|---|---|
| Power Management: | Enabled (see SUT Notes) |
| Operating System (OS): | Windows Server 2012 R2 Datacenter |
| OS Version: | 6.3 (Build 9600) |
| Filesystem: | NTFS |
| JVM Vendor: | Oracle Corporation |
| JVM Version: | Java HotSpot(TM) 64-Bit Server VM (build 24.80-b11, mixed mode), version 1.7.0_80 |
| JVM Command-line Options: | -server -Xmn19g -Xms21g -Xmx21g -XX:SurvivorRatio=1 -XX:TargetSurvivorRatio=99 -XX:ParallelGCThreads=28 -XX:AllocatePrefetchDistance=256 -XX:AllocatePrefetchLines=4 -XX:LoopUnrollLimit=45 -XX:InitialTenuringThreshold=12 -XX:MaxTenuringThreshold=15 -XX:InlineSmallCode=9000 -XX:MaxInlineSize=270 -XX:FreqInlineSize=6000 -XX:+UseLargePages -XX:+UseParallelOldGC -XX:+AggressiveOpts |
| JVM Affinity: | start /NODE [0,1,2,3] /AFFINITY [0xFFFFFFF] |
| JVM Instances: | 4 |
| JVM Initial Heap (MB): | 21000 |
| JVM Maximum Heap (MB): | 21000 |
| JVM Address Bits: | 64 |
| Boot Firmware Version: | I42 v1.32 (02/01/2018) |
| Management Firmware Version: | 1.15 Aug 17 2017 |
| Workload Version: | SSJ 1.2.10 |
| Director Location: | Controller |
| Other Software: | HPE Composer Version 3.10.07 (HPE OneView) with HPE Synergy Custom SPP Bundle 2017.10.20180323; Microsoft Windows KB4054519, KB4056898 |
| JVM Instance | ssj_ops@100% |
|---|---|
| NODE05.001 | 1,427,127 |
| NODE05.002 | 1,403,387 |
| NODE05.003 | 1,435,141 |
| NODE05.004 | 1,423,500 |
| ssj_ops@100% | 5,689,156 |
| ssj_ops@100% per JVM | 1,422,289 |

| Target Load | Actual Load | ssj_ops | |
|---|---|---|---|
| Target | Actual | ||
| Calibration 1 | 1,426,767 | ||
| Calibration 2 | 1,426,996 | ||
| Calibration 3 | 1,432,434 | ||
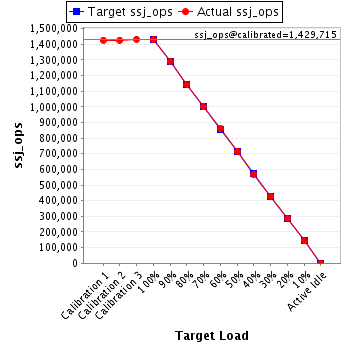
| ssj_ops@calibrated=1,429,715 | |||
| 100% | 99.8% | 1,429,715 | 1,427,127 |
| 90% | 90.3% | 1,286,743 | 1,290,902 |
| 80% | 79.9% | 1,143,772 | 1,142,947 |
| 70% | 69.9% | 1,000,800 | 999,677 |
| 60% | 60.1% | 857,829 | 859,901 |
| 50% | 50.1% | 714,857 | 715,825 |
| 40% | 39.9% | 571,886 | 570,248 |
| 30% | 30.1% | 428,914 | 429,639 |
| 20% | 20.1% | 285,943 | 286,988 |
| 10% | 10.0% | 142,971 | 142,850 |
| Active Idle | 0 | 0 | |
| Target Load | Actual Load | ssj_ops | |
|---|---|---|---|
| Target | Actual | ||
| Calibration 1 | 1,404,523 | ||
| Calibration 2 | 1,406,645 | ||
| Calibration 3 | 1,410,097 | ||
| ssj_ops@calibrated=1,408,371 | |||
| 100% | 99.6% | 1,408,371 | 1,403,387 |
| 90% | 90.1% | 1,267,534 | 1,268,668 |
| 80% | 80.1% | 1,126,697 | 1,127,971 |
| 70% | 70.1% | 985,860 | 986,851 |
| 60% | 59.8% | 845,023 | 842,785 |
| 50% | 49.9% | 704,186 | 702,324 |
| 40% | 40.0% | 563,349 | 562,694 |
| 30% | 29.7% | 422,511 | 418,986 |
| 20% | 20.2% | 281,674 | 284,336 |
| 10% | 10.0% | 140,837 | 140,892 |
| Active Idle | 0 | 0 | |

| Target Load | Actual Load | ssj_ops | |
|---|---|---|---|
| Target | Actual | ||
| Calibration 1 | 1,442,535 | ||
| Calibration 2 | 1,441,984 | ||
| Calibration 3 | 1,440,018 | ||
| ssj_ops@calibrated=1,441,001 | |||
| 100% | 99.6% | 1,441,001 | 1,435,141 |
| 90% | 89.9% | 1,296,901 | 1,295,901 |
| 80% | 79.9% | 1,152,801 | 1,150,767 |
| 70% | 69.9% | 1,008,701 | 1,007,950 |
| 60% | 60.0% | 864,601 | 864,481 |
| 50% | 49.9% | 720,500 | 718,383 |
| 40% | 40.0% | 576,400 | 575,876 |
| 30% | 30.1% | 432,300 | 433,975 |
| 20% | 19.8% | 288,200 | 285,985 |
| 10% | 10.0% | 144,100 | 144,103 |
| Active Idle | 0 | 0 | |

| Target Load | Actual Load | ssj_ops | |
|---|---|---|---|
| Target | Actual | ||
| Calibration 1 | 1,429,662 | ||
| Calibration 2 | 1,427,846 | ||
| Calibration 3 | 1,431,800 | ||
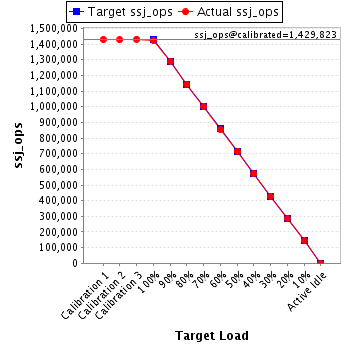
| ssj_ops@calibrated=1,429,823 | |||
| 100% | 99.6% | 1,429,823 | 1,423,500 |
| 90% | 90.1% | 1,286,841 | 1,288,905 |
| 80% | 80.0% | 1,143,859 | 1,143,569 |
| 70% | 70.1% | 1,000,876 | 1,002,024 |
| 60% | 59.8% | 857,894 | 855,036 |
| 50% | 50.1% | 714,912 | 716,020 |
| 40% | 40.0% | 571,929 | 571,549 |
| 30% | 30.0% | 428,947 | 428,651 |
| 20% | 19.9% | 285,965 | 284,041 |
| 10% | 10.1% | 142,982 | 143,931 |
| Active Idle | 0 | 0 | |