
SPECpower_ssj2008
Host 'NODE08' Performance Report
Copyright © 2007-2018 Standard Performance Evaluation Corporation
| Hewlett Packard Enterprise Synergy 480 Gen10 Compute Module | ssj_ops@100% = 5,720,166 ssj_ops@100% per JVM = 1,430,042 |
||||
| Test Sponsor: | Hewlett Packard Enterprise | SPEC License #: | 3 | Test Method: | Multi Node |
| Tested By: | Hewlett Packard Enterprise | Test Location: | Houston, TX, USA | Test Date: | Aug 24, 2018 |
| Hardware Availability: | Jun-2018 | Software Availability: | Mar-2018 | Publication: | Sep 12, 2018 |
| System Source: | Single Supplier | System Designation: | Server | Power Provisioning: | Line-powered |
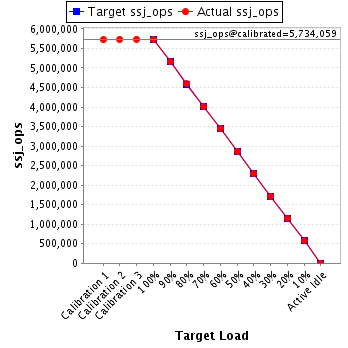
| Target Load | Actual Load | ssj_ops | |
|---|---|---|---|
| Target | Actual | ||
| Calibration 1 | 5,723,248 | ||
| Calibration 2 | 5,730,867 | ||
| Calibration 3 | 5,737,251 | ||
| ssj_ops@calibrated=5,734,059 | |||
| 100% | 99.8% | 5,734,059 | 5,720,166 |
| 90% | 89.9% | 5,160,653 | 5,157,145 |
| 80% | 80.1% | 4,587,247 | 4,591,348 |
| 70% | 69.9% | 4,013,841 | 4,008,800 |
| 60% | 60.0% | 3,440,435 | 3,440,022 |
| 50% | 50.0% | 2,867,029 | 2,867,134 |
| 40% | 40.0% | 2,293,623 | 2,293,650 |
| 30% | 30.0% | 1,720,218 | 1,718,612 |
| 20% | 20.1% | 1,146,812 | 1,150,322 |
| 10% | 10.0% | 573,406 | 575,486 |
| Active Idle | 0 | 0 | |
| Set Identifier: | SUT |
| Set Description: | System Under Test |
| # of Identical Nodes: | 8 |
| Comment: | SUT |
| Hardware | |
|---|---|
| Hardware Vendor: | Hewlett Packard Enterprise |
| Model: | Synergy 480 Gen10 Compute Module |
| Form Factor: | Other |
| CPU Name: | Intel Xeon Platinum 8180 2.50GHz |
| CPU Characteristics: | 28-Core, 2.50 GHz, 38.5 MB L3 Cache |
| CPU Frequency (MHz): | 2500 |
| CPU(s) Enabled: | 56 cores, 2 chips, 28 cores/chip |
| Hardware Threads: | 112 (2 / core) |
| CPU(s) Orderable: | 1,2 chips |
| Primary Cache: | 32 KB I + 32 KB D on chip per core |
| Secondary Cache: | 1 MB I+D on chip per core |
| Tertiary Cache: | 39424 KB I+D on chip per chip |
| Other Cache: | None |
| Memory Amount (GB): | 192 |
| # and size of DIMM: | 12 x 16384 MB |
| Memory Details: | 12 x 16GB 2Rx8 PC4-2666-V ECC; slots 1, 3, 5, 8, 10 and 12 populated on each CPU socket |
| Power Supply Quantity and Rating (W): | None |
| Power Supply Details: | Shared |
| Disk Drive: | 1 x HPE Synergy 480 Gen10 M.2 FIO Adapter Board Kit (873165-B21); 1 x HPE 480GB SATA 6G Read Intensive M.2 2280 SSD (875498-B21) |
| Disk Controller: | 1 x HPE Smart Array S100i SR Gen10 |
| # and type of Network Interface Cards (NICs) Installed: | 1 x HPE Synergy 3820C 10/20Gb 2-port Converged Network Adapter (777430-B21) |
| NICs Enabled in Firmware / OS / Connected: | 2/1/1 |
| Network Speed (Mbit): | 10000 |
| Keyboard: | None |
| Mouse: | None |
| Monitor: | None |
| Optical Drives: | No |
| Other Hardware: | None |
| Software | |
|---|---|
| Power Management: | Enabled (see SUT Notes) |
| Operating System (OS): | Windows Server 2012 R2 Datacenter |
| OS Version: | 6.3 (Build 9600) |
| Filesystem: | NTFS |
| JVM Vendor: | Oracle Corporation |
| JVM Version: | Java HotSpot(TM) 64-Bit Server VM (build 24.80-b11, mixed mode), version 1.7.0_80 |
| JVM Command-line Options: | -server -Xmn19g -Xms21g -Xmx21g -XX:SurvivorRatio=1 -XX:TargetSurvivorRatio=99 -XX:ParallelGCThreads=28 -XX:AllocatePrefetchDistance=256 -XX:AllocatePrefetchLines=4 -XX:LoopUnrollLimit=45 -XX:InitialTenuringThreshold=12 -XX:MaxTenuringThreshold=15 -XX:InlineSmallCode=9000 -XX:MaxInlineSize=270 -XX:FreqInlineSize=6000 -XX:+UseLargePages -XX:+UseParallelOldGC -XX:+AggressiveOpts |
| JVM Affinity: | start /NODE [0,1,2,3] /AFFINITY [0xFFFFFFF] |
| JVM Instances: | 4 |
| JVM Initial Heap (MB): | 21000 |
| JVM Maximum Heap (MB): | 21000 |
| JVM Address Bits: | 64 |
| Boot Firmware Version: | I42 v1.32 (02/01/2018) |
| Management Firmware Version: | 1.15 Aug 17 2017 |
| Workload Version: | SSJ 1.2.10 |
| Director Location: | Controller |
| Other Software: | HPE Composer Version 3.10.07 (HPE OneView) with HPE Synergy Custom SPP Bundle 2017.10.20180323; Microsoft Windows KB4054519, KB4056898 |
| JVM Instance | ssj_ops@100% |
|---|---|
| NODE08.001 | 1,430,656 |
| NODE08.002 | 1,428,832 |
| NODE08.003 | 1,432,585 |
| NODE08.004 | 1,428,094 |
| ssj_ops@100% | 5,720,166 |
| ssj_ops@100% per JVM | 1,430,042 |

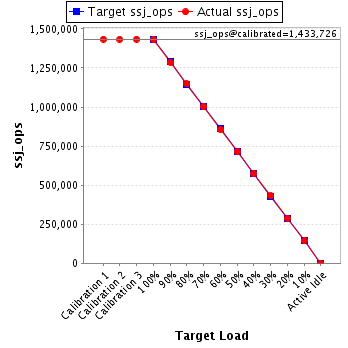
| Target Load | Actual Load | ssj_ops | |
|---|---|---|---|
| Target | Actual | ||
| Calibration 1 | 1,433,476 | ||
| Calibration 2 | 1,433,141 | ||
| Calibration 3 | 1,434,312 | ||
| ssj_ops@calibrated=1,433,726 | |||
| 100% | 99.8% | 1,433,726 | 1,430,656 |
| 90% | 89.8% | 1,290,354 | 1,287,861 |
| 80% | 80.0% | 1,146,981 | 1,147,405 |
| 70% | 69.9% | 1,003,608 | 1,002,707 |
| 60% | 59.8% | 860,236 | 857,460 |
| 50% | 49.8% | 716,863 | 713,609 |
| 40% | 40.0% | 573,490 | 573,962 |
| 30% | 30.1% | 430,118 | 430,891 |
| 20% | 20.0% | 286,745 | 286,789 |
| 10% | 10.0% | 143,373 | 143,948 |
| Active Idle | 0 | 0 | |
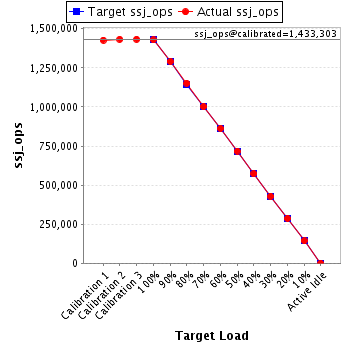
| Target Load | Actual Load | ssj_ops | |
|---|---|---|---|
| Target | Actual | ||
| Calibration 1 | 1,428,105 | ||
| Calibration 2 | 1,432,847 | ||
| Calibration 3 | 1,433,759 | ||
| ssj_ops@calibrated=1,433,303 | |||
| 100% | 99.7% | 1,433,303 | 1,428,832 |
| 90% | 90.1% | 1,289,973 | 1,291,458 |
| 80% | 80.4% | 1,146,643 | 1,152,664 |
| 70% | 69.9% | 1,003,312 | 1,002,353 |
| 60% | 60.2% | 859,982 | 862,980 |
| 50% | 50.1% | 716,652 | 717,946 |
| 40% | 39.9% | 573,321 | 572,068 |
| 30% | 30.0% | 429,991 | 429,332 |
| 20% | 20.1% | 286,661 | 287,503 |
| 10% | 10.0% | 143,330 | 143,429 |
| Active Idle | 0 | 0 | |
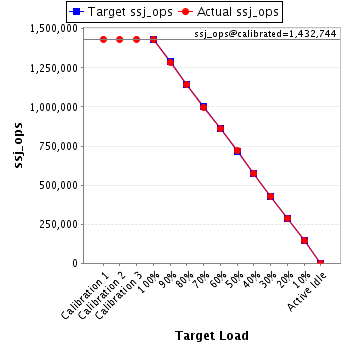
| Target Load | Actual Load | ssj_ops | |
|---|---|---|---|
| Target | Actual | ||
| Calibration 1 | 1,432,766 | ||
| Calibration 2 | 1,432,040 | ||
| Calibration 3 | 1,433,448 | ||
| ssj_ops@calibrated=1,432,744 | |||
| 100% | 100.0% | 1,432,744 | 1,432,585 |
| 90% | 89.8% | 1,289,469 | 1,286,334 |
| 80% | 79.8% | 1,146,195 | 1,143,257 |
| 70% | 69.8% | 1,002,921 | 999,355 |
| 60% | 60.0% | 859,646 | 859,385 |
| 50% | 50.2% | 716,372 | 719,224 |
| 40% | 40.1% | 573,098 | 574,291 |
| 30% | 29.9% | 429,823 | 428,927 |
| 20% | 20.1% | 286,549 | 288,059 |
| 10% | 10.1% | 143,274 | 144,495 |
| Active Idle | 0 | 0 | |
| Target Load | Actual Load | ssj_ops | |
|---|---|---|---|
| Target | Actual | ||
| Calibration 1 | 1,428,901 | ||
| Calibration 2 | 1,432,839 | ||
| Calibration 3 | 1,435,731 | ||
| ssj_ops@calibrated=1,434,285 | |||
| 100% | 99.6% | 1,434,285 | 1,428,094 |
| 90% | 90.0% | 1,290,857 | 1,291,492 |
| 80% | 80.0% | 1,147,428 | 1,148,022 |
| 70% | 70.0% | 1,004,000 | 1,004,385 |
| 60% | 60.0% | 860,571 | 860,197 |
| 50% | 49.9% | 717,143 | 716,355 |
| 40% | 40.0% | 573,714 | 573,330 |
| 30% | 29.9% | 430,286 | 429,462 |
| 20% | 20.1% | 286,857 | 287,970 |
| 10% | 10.0% | 143,429 | 143,614 |
| Active Idle | 0 | 0 | |
