
SPECpower_ssj2008
Host 'NODE06' Performance Report
Copyright © 2007-2018 Standard Performance Evaluation Corporation
| Hewlett Packard Enterprise Synergy 480 Gen10 Compute Module | ssj_ops@100% = 5,744,733 ssj_ops@100% per JVM = 1,436,183 |
||||
| Test Sponsor: | Hewlett Packard Enterprise | SPEC License #: | 3 | Test Method: | Multi Node |
| Tested By: | Hewlett Packard Enterprise | Test Location: | Houston, TX, USA | Test Date: | Aug 24, 2018 |
| Hardware Availability: | Jun-2018 | Software Availability: | Mar-2018 | Publication: | Sep 12, 2018 |
| System Source: | Single Supplier | System Designation: | Server | Power Provisioning: | Line-powered |
| Target Load | Actual Load | ssj_ops | |
|---|---|---|---|
| Target | Actual | ||
| Calibration 1 | 5,758,317 | ||
| Calibration 2 | 5,757,309 | ||
| Calibration 3 | 5,759,622 | ||
| ssj_ops@calibrated=5,758,466 | |||
| 100% | 99.8% | 5,758,466 | 5,744,733 |
| 90% | 89.9% | 5,182,619 | 5,175,447 |
| 80% | 80.1% | 4,606,773 | 4,614,333 |
| 70% | 69.9% | 4,030,926 | 4,026,799 |
| 60% | 60.0% | 3,455,079 | 3,455,725 |
| 50% | 50.1% | 2,879,233 | 2,883,847 |
| 40% | 40.0% | 2,303,386 | 2,301,047 |
| 30% | 29.9% | 1,727,540 | 1,722,412 |
| 20% | 20.0% | 1,151,693 | 1,149,650 |
| 10% | 10.0% | 575,847 | 575,470 |
| Active Idle | 0 | 0 | |

| Set Identifier: | SUT |
| Set Description: | System Under Test |
| # of Identical Nodes: | 8 |
| Comment: | SUT |
| Hardware | |
|---|---|
| Hardware Vendor: | Hewlett Packard Enterprise |
| Model: | Synergy 480 Gen10 Compute Module |
| Form Factor: | Other |
| CPU Name: | Intel Xeon Platinum 8180 2.50GHz |
| CPU Characteristics: | 28-Core, 2.50 GHz, 38.5 MB L3 Cache |
| CPU Frequency (MHz): | 2500 |
| CPU(s) Enabled: | 56 cores, 2 chips, 28 cores/chip |
| Hardware Threads: | 112 (2 / core) |
| CPU(s) Orderable: | 1,2 chips |
| Primary Cache: | 32 KB I + 32 KB D on chip per core |
| Secondary Cache: | 1 MB I+D on chip per core |
| Tertiary Cache: | 39424 KB I+D on chip per chip |
| Other Cache: | None |
| Memory Amount (GB): | 192 |
| # and size of DIMM: | 12 x 16384 MB |
| Memory Details: | 12 x 16GB 2Rx8 PC4-2666-V ECC; slots 1, 3, 5, 8, 10 and 12 populated on each CPU socket |
| Power Supply Quantity and Rating (W): | None |
| Power Supply Details: | Shared |
| Disk Drive: | 1 x HPE Synergy 480 Gen10 M.2 FIO Adapter Board Kit (873165-B21); 1 x HPE 480GB SATA 6G Read Intensive M.2 2280 SSD (875498-B21) |
| Disk Controller: | 1 x HPE Smart Array S100i SR Gen10 |
| # and type of Network Interface Cards (NICs) Installed: | 1 x HPE Synergy 3820C 10/20Gb 2-port Converged Network Adapter (777430-B21) |
| NICs Enabled in Firmware / OS / Connected: | 2/1/1 |
| Network Speed (Mbit): | 10000 |
| Keyboard: | None |
| Mouse: | None |
| Monitor: | None |
| Optical Drives: | No |
| Other Hardware: | None |
| Software | |
|---|---|
| Power Management: | Enabled (see SUT Notes) |
| Operating System (OS): | Windows Server 2012 R2 Datacenter |
| OS Version: | 6.3 (Build 9600) |
| Filesystem: | NTFS |
| JVM Vendor: | Oracle Corporation |
| JVM Version: | Java HotSpot(TM) 64-Bit Server VM (build 24.80-b11, mixed mode), version 1.7.0_80 |
| JVM Command-line Options: | -server -Xmn19g -Xms21g -Xmx21g -XX:SurvivorRatio=1 -XX:TargetSurvivorRatio=99 -XX:ParallelGCThreads=28 -XX:AllocatePrefetchDistance=256 -XX:AllocatePrefetchLines=4 -XX:LoopUnrollLimit=45 -XX:InitialTenuringThreshold=12 -XX:MaxTenuringThreshold=15 -XX:InlineSmallCode=9000 -XX:MaxInlineSize=270 -XX:FreqInlineSize=6000 -XX:+UseLargePages -XX:+UseParallelOldGC -XX:+AggressiveOpts |
| JVM Affinity: | start /NODE [0,1,2,3] /AFFINITY [0xFFFFFFF] |
| JVM Instances: | 4 |
| JVM Initial Heap (MB): | 21000 |
| JVM Maximum Heap (MB): | 21000 |
| JVM Address Bits: | 64 |
| Boot Firmware Version: | I42 v1.32 (02/01/2018) |
| Management Firmware Version: | 1.15 Aug 17 2017 |
| Workload Version: | SSJ 1.2.10 |
| Director Location: | Controller |
| Other Software: | HPE Composer Version 3.10.07 (HPE OneView) with HPE Synergy Custom SPP Bundle 2017.10.20180323; Microsoft Windows KB4054519, KB4056898 |
| JVM Instance | ssj_ops@100% |
|---|---|
| NODE06.001 | 1,443,802 |
| NODE06.002 | 1,427,659 |
| NODE06.003 | 1,431,680 |
| NODE06.004 | 1,441,593 |
| ssj_ops@100% | 5,744,733 |
| ssj_ops@100% per JVM | 1,436,183 |

| Target Load | Actual Load | ssj_ops | |
|---|---|---|---|
| Target | Actual | ||
| Calibration 1 | 1,450,906 | ||
| Calibration 2 | 1,449,270 | ||
| Calibration 3 | 1,447,468 | ||
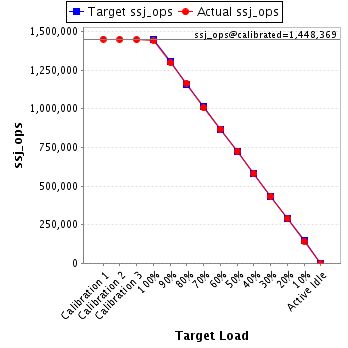
| ssj_ops@calibrated=1,448,369 | |||
| 100% | 99.7% | 1,448,369 | 1,443,802 |
| 90% | 89.7% | 1,303,532 | 1,299,263 |
| 80% | 80.4% | 1,158,695 | 1,163,875 |
| 70% | 69.6% | 1,013,858 | 1,007,627 |
| 60% | 60.0% | 869,022 | 869,242 |
| 50% | 50.1% | 724,185 | 725,882 |
| 40% | 40.0% | 579,348 | 579,812 |
| 30% | 29.9% | 434,511 | 432,886 |
| 20% | 19.9% | 289,674 | 288,298 |
| 10% | 9.9% | 144,837 | 142,956 |
| Active Idle | 0 | 0 | |
| Target Load | Actual Load | ssj_ops | |
|---|---|---|---|
| Target | Actual | ||
| Calibration 1 | 1,431,591 | ||
| Calibration 2 | 1,429,905 | ||
| Calibration 3 | 1,432,273 | ||
| ssj_ops@calibrated=1,431,089 | |||
| 100% | 99.8% | 1,431,089 | 1,427,659 |
| 90% | 89.8% | 1,287,980 | 1,285,657 |
| 80% | 80.1% | 1,144,871 | 1,146,299 |
| 70% | 69.9% | 1,001,762 | 1,000,810 |
| 60% | 59.9% | 858,653 | 856,990 |
| 50% | 49.9% | 715,545 | 714,619 |
| 40% | 39.9% | 572,436 | 571,615 |
| 30% | 29.8% | 429,327 | 426,577 |
| 20% | 20.1% | 286,218 | 287,667 |
| 10% | 10.1% | 143,109 | 144,417 |
| Active Idle | 0 | 0 | |

| Target Load | Actual Load | ssj_ops | |
|---|---|---|---|
| Target | Actual | ||
| Calibration 1 | 1,433,087 | ||
| Calibration 2 | 1,434,270 | ||
| Calibration 3 | 1,433,573 | ||
| ssj_ops@calibrated=1,433,921 | |||
| 100% | 99.8% | 1,433,921 | 1,431,680 |
| 90% | 90.0% | 1,290,529 | 1,290,595 |
| 80% | 80.1% | 1,147,137 | 1,148,481 |
| 70% | 70.1% | 1,003,745 | 1,004,958 |
| 60% | 60.1% | 860,353 | 861,281 |
| 50% | 50.2% | 716,961 | 719,677 |
| 40% | 40.0% | 573,569 | 572,983 |
| 30% | 29.9% | 430,176 | 428,781 |
| 20% | 19.9% | 286,784 | 285,417 |
| 10% | 10.0% | 143,392 | 143,752 |
| Active Idle | 0 | 0 | |

| Target Load | Actual Load | ssj_ops | |
|---|---|---|---|
| Target | Actual | ||
| Calibration 1 | 1,442,732 | ||
| Calibration 2 | 1,443,864 | ||
| Calibration 3 | 1,446,308 | ||
| ssj_ops@calibrated=1,445,086 | |||
| 100% | 99.8% | 1,445,086 | 1,441,593 |
| 90% | 90.0% | 1,300,577 | 1,299,933 |
| 80% | 80.0% | 1,156,069 | 1,155,678 |
| 70% | 70.1% | 1,011,560 | 1,013,404 |
| 60% | 60.1% | 867,052 | 868,212 |
| 50% | 50.1% | 722,543 | 723,669 |
| 40% | 39.9% | 578,034 | 576,637 |
| 30% | 30.0% | 433,526 | 434,168 |
| 20% | 19.9% | 289,017 | 288,268 |
| 10% | 10.0% | 144,509 | 144,345 |
| Active Idle | 0 | 0 | |
