
SPECpower_ssj2008
Host 'NODE03' Performance Report
Copyright © 2007-2018 Standard Performance Evaluation Corporation
| Hewlett Packard Enterprise Synergy 480 Gen10 Compute Module | ssj_ops@100% = 5,720,497 ssj_ops@100% per JVM = 1,430,124 |
||||
| Test Sponsor: | Hewlett Packard Enterprise | SPEC License #: | 3 | Test Method: | Multi Node |
| Tested By: | Hewlett Packard Enterprise | Test Location: | Houston, TX, USA | Test Date: | Aug 24, 2018 |
| Hardware Availability: | Jun-2018 | Software Availability: | Mar-2018 | Publication: | Sep 12, 2018 |
| System Source: | Single Supplier | System Designation: | Server | Power Provisioning: | Line-powered |
| Target Load | Actual Load | ssj_ops | |
|---|---|---|---|
| Target | Actual | ||
| Calibration 1 | 5,734,017 | ||
| Calibration 2 | 5,733,422 | ||
| Calibration 3 | 5,746,158 | ||
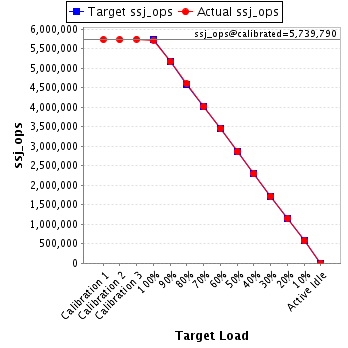
| ssj_ops@calibrated=5,739,790 | |||
| 100% | 99.7% | 5,739,790 | 5,720,497 |
| 90% | 90.0% | 5,165,811 | 5,165,326 |
| 80% | 80.1% | 4,591,832 | 4,600,421 |
| 70% | 70.0% | 4,017,853 | 4,016,109 |
| 60% | 60.1% | 3,443,874 | 3,451,370 |
| 50% | 50.0% | 2,869,895 | 2,867,229 |
| 40% | 39.9% | 2,295,916 | 2,291,538 |
| 30% | 29.9% | 1,721,937 | 1,718,632 |
| 20% | 20.0% | 1,147,958 | 1,148,058 |
| 10% | 10.0% | 573,979 | 574,609 |
| Active Idle | 0 | 0 | |
| Set Identifier: | SUT |
| Set Description: | System Under Test |
| # of Identical Nodes: | 8 |
| Comment: | SUT |
| Hardware | |
|---|---|
| Hardware Vendor: | Hewlett Packard Enterprise |
| Model: | Synergy 480 Gen10 Compute Module |
| Form Factor: | Other |
| CPU Name: | Intel Xeon Platinum 8180 2.50GHz |
| CPU Characteristics: | 28-Core, 2.50 GHz, 38.5 MB L3 Cache |
| CPU Frequency (MHz): | 2500 |
| CPU(s) Enabled: | 56 cores, 2 chips, 28 cores/chip |
| Hardware Threads: | 112 (2 / core) |
| CPU(s) Orderable: | 1,2 chips |
| Primary Cache: | 32 KB I + 32 KB D on chip per core |
| Secondary Cache: | 1 MB I+D on chip per core |
| Tertiary Cache: | 39424 KB I+D on chip per chip |
| Other Cache: | None |
| Memory Amount (GB): | 192 |
| # and size of DIMM: | 12 x 16384 MB |
| Memory Details: | 12 x 16GB 2Rx8 PC4-2666-V ECC; slots 1, 3, 5, 8, 10 and 12 populated on each CPU socket |
| Power Supply Quantity and Rating (W): | None |
| Power Supply Details: | Shared |
| Disk Drive: | 1 x HPE Synergy 480 Gen10 M.2 FIO Adapter Board Kit (873165-B21); 1 x HPE 480GB SATA 6G Read Intensive M.2 2280 SSD (875498-B21) |
| Disk Controller: | 1 x HPE Smart Array S100i SR Gen10 |
| # and type of Network Interface Cards (NICs) Installed: | 1 x HPE Synergy 3820C 10/20Gb 2-port Converged Network Adapter (777430-B21) |
| NICs Enabled in Firmware / OS / Connected: | 2/1/1 |
| Network Speed (Mbit): | 10000 |
| Keyboard: | None |
| Mouse: | None |
| Monitor: | None |
| Optical Drives: | No |
| Other Hardware: | None |
| Software | |
|---|---|
| Power Management: | Enabled (see SUT Notes) |
| Operating System (OS): | Windows Server 2012 R2 Datacenter |
| OS Version: | 6.3 (Build 9600) |
| Filesystem: | NTFS |
| JVM Vendor: | Oracle Corporation |
| JVM Version: | Java HotSpot(TM) 64-Bit Server VM (build 24.80-b11, mixed mode), version 1.7.0_80 |
| JVM Command-line Options: | -server -Xmn19g -Xms21g -Xmx21g -XX:SurvivorRatio=1 -XX:TargetSurvivorRatio=99 -XX:ParallelGCThreads=28 -XX:AllocatePrefetchDistance=256 -XX:AllocatePrefetchLines=4 -XX:LoopUnrollLimit=45 -XX:InitialTenuringThreshold=12 -XX:MaxTenuringThreshold=15 -XX:InlineSmallCode=9000 -XX:MaxInlineSize=270 -XX:FreqInlineSize=6000 -XX:+UseLargePages -XX:+UseParallelOldGC -XX:+AggressiveOpts |
| JVM Affinity: | start /NODE [0,1,2,3] /AFFINITY [0xFFFFFFF] |
| JVM Instances: | 4 |
| JVM Initial Heap (MB): | 21000 |
| JVM Maximum Heap (MB): | 21000 |
| JVM Address Bits: | 64 |
| Boot Firmware Version: | I42 v1.32 (02/01/2018) |
| Management Firmware Version: | 1.15 Aug 17 2017 |
| Workload Version: | SSJ 1.2.10 |
| Director Location: | Controller |
| Other Software: | HPE Composer Version 3.10.07 (HPE OneView) with HPE Synergy Custom SPP Bundle 2017.10.20180323; Microsoft Windows KB4054519, KB4056898 |
| JVM Instance | ssj_ops@100% |
|---|---|
| NODE03.001 | 1,428,239 |
| NODE03.002 | 1,426,232 |
| NODE03.003 | 1,437,185 |
| NODE03.004 | 1,428,840 |
| ssj_ops@100% | 5,720,497 |
| ssj_ops@100% per JVM | 1,430,124 |

| Target Load | Actual Load | ssj_ops | |
|---|---|---|---|
| Target | Actual | ||
| Calibration 1 | 1,431,457 | ||
| Calibration 2 | 1,429,981 | ||
| Calibration 3 | 1,434,402 | ||
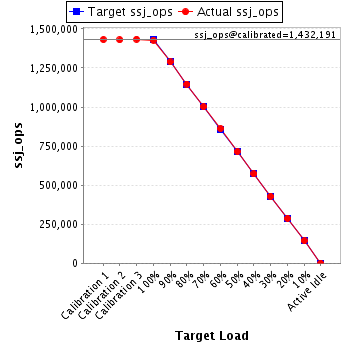
| ssj_ops@calibrated=1,432,191 | |||
| 100% | 99.7% | 1,432,191 | 1,428,239 |
| 90% | 90.0% | 1,288,972 | 1,288,347 |
| 80% | 80.1% | 1,145,753 | 1,147,294 |
| 70% | 69.9% | 1,002,534 | 1,001,776 |
| 60% | 60.2% | 859,315 | 862,347 |
| 50% | 49.9% | 716,096 | 714,399 |
| 40% | 39.9% | 572,877 | 571,714 |
| 30% | 29.9% | 429,657 | 428,597 |
| 20% | 20.1% | 286,438 | 287,445 |
| 10% | 10.0% | 143,219 | 143,779 |
| Active Idle | 0 | 0 | |
| Target Load | Actual Load | ssj_ops | |
|---|---|---|---|
| Target | Actual | ||
| Calibration 1 | 1,430,319 | ||
| Calibration 2 | 1,430,023 | ||
| Calibration 3 | 1,433,566 | ||
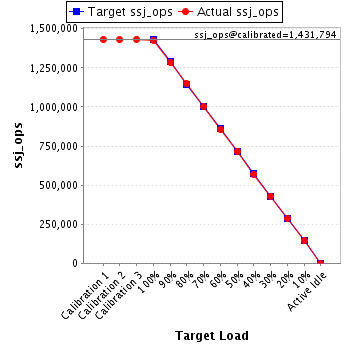
| ssj_ops@calibrated=1,431,794 | |||
| 100% | 99.6% | 1,431,794 | 1,426,232 |
| 90% | 89.8% | 1,288,615 | 1,286,183 |
| 80% | 80.2% | 1,145,435 | 1,148,410 |
| 70% | 70.1% | 1,002,256 | 1,003,072 |
| 60% | 59.9% | 859,076 | 857,852 |
| 50% | 50.0% | 715,897 | 715,368 |
| 40% | 39.9% | 572,718 | 570,866 |
| 30% | 30.0% | 429,538 | 429,654 |
| 20% | 20.0% | 286,359 | 286,080 |
| 10% | 10.0% | 143,179 | 142,666 |
| Active Idle | 0 | 0 | |
| Target Load | Actual Load | ssj_ops | |
|---|---|---|---|
| Target | Actual | ||
| Calibration 1 | 1,441,820 | ||
| Calibration 2 | 1,442,087 | ||
| Calibration 3 | 1,444,012 | ||
| ssj_ops@calibrated=1,443,050 | |||
| 100% | 99.6% | 1,443,050 | 1,437,185 |
| 90% | 90.2% | 1,298,745 | 1,302,304 |
| 80% | 80.2% | 1,154,440 | 1,157,881 |
| 70% | 69.8% | 1,010,135 | 1,007,895 |
| 60% | 60.1% | 865,830 | 867,596 |
| 50% | 50.1% | 721,525 | 722,932 |
| 40% | 40.0% | 577,220 | 577,410 |
| 30% | 30.0% | 432,915 | 432,631 |
| 20% | 19.9% | 288,610 | 286,941 |
| 10% | 10.0% | 144,305 | 144,400 |
| Active Idle | 0 | 0 | |

| Target Load | Actual Load | ssj_ops | |
|---|---|---|---|
| Target | Actual | ||
| Calibration 1 | 1,430,421 | ||
| Calibration 2 | 1,431,332 | ||
| Calibration 3 | 1,434,178 | ||
| ssj_ops@calibrated=1,432,755 | |||
| 100% | 99.7% | 1,432,755 | 1,428,840 |
| 90% | 89.9% | 1,289,479 | 1,288,492 |
| 80% | 80.0% | 1,146,204 | 1,146,835 |
| 70% | 70.0% | 1,002,928 | 1,003,366 |
| 60% | 60.3% | 859,653 | 863,576 |
| 50% | 49.9% | 716,377 | 714,529 |
| 40% | 39.9% | 573,102 | 571,550 |
| 30% | 29.9% | 429,826 | 427,751 |
| 20% | 20.1% | 286,551 | 287,591 |
| 10% | 10.0% | 143,275 | 143,764 |
| Active Idle | 0 | 0 | |
