SPECpower_ssj2008
Host 'NODE09' Performance Report
Copyright © 2007-2018 Standard Performance Evaluation Corporation
| Hewlett Packard Enterprise Synergy 480 Gen10 Compute Module | ssj_ops@100% = 5,754,801 ssj_ops@100% per JVM = 1,438,700 |
||||
| Test Sponsor: | Hewlett Packard Enterprise | SPEC License #: | 3 | Test Method: | Multi Node |
| Tested By: | Hewlett Packard Enterprise | Test Location: | Houston, TX, USA | Test Date: | Aug 26, 2018 |
| Hardware Availability: | Jun-2018 | Software Availability: | Mar-2018 | Publication: | Sep 12, 2018 |
| System Source: | Single Supplier | System Designation: | Server | Power Provisioning: | Line-powered |
| Target Load | Actual Load | ssj_ops | |
|---|---|---|---|
| Target | Actual | ||
| Calibration 1 | 5,764,320 | ||
| Calibration 2 | 5,761,281 | ||
| Calibration 3 | 5,776,147 | ||
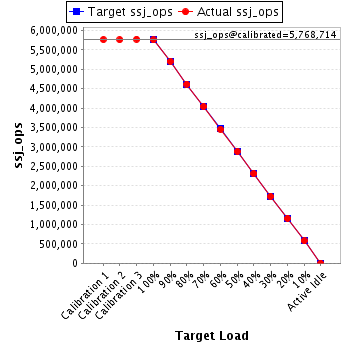
| ssj_ops@calibrated=5,768,714 | |||
| 100% | 99.8% | 5,768,714 | 5,754,801 |
| 90% | 90.2% | 5,191,842 | 5,203,045 |
| 80% | 80.0% | 4,614,971 | 4,617,540 |
| 70% | 70.1% | 4,038,100 | 4,041,986 |
| 60% | 59.9% | 3,461,228 | 3,454,190 |
| 50% | 49.9% | 2,884,357 | 2,880,534 |
| 40% | 40.0% | 2,307,485 | 2,307,700 |
| 30% | 29.9% | 1,730,614 | 1,723,591 |
| 20% | 20.0% | 1,153,743 | 1,155,587 |
| 10% | 10.0% | 576,871 | 578,245 |
| Active Idle | 0 | 0 | |
| Set Identifier: | SUT |
| Set Description: | System Under Test |
| # of Identical Nodes: | 9 |
| Comment: | SUT |
| Hardware | |
|---|---|
| Hardware Vendor: | Hewlett Packard Enterprise |
| Model: | Synergy 480 Gen10 Compute Module |
| Form Factor: | Other |
| CPU Name: | Intel Xeon Platinum 8180 2.50GHz |
| CPU Characteristics: | 28-Core, 2.50 GHz, 38.5 MB L3 Cache |
| CPU Frequency (MHz): | 2500 |
| CPU(s) Enabled: | 56 cores, 2 chips, 28 cores/chip |
| Hardware Threads: | 112 (2 / core) |
| CPU(s) Orderable: | 1,2 chips |
| Primary Cache: | 32 KB I + 32 KB D on chip per core |
| Secondary Cache: | 1 MB I+D on chip per core |
| Tertiary Cache: | 39424 KB I+D on chip per chip |
| Other Cache: | None |
| Memory Amount (GB): | 192 |
| # and size of DIMM: | 12 x 16384 MB |
| Memory Details: | 12 x 16GB 2Rx8 PC4-2666-V ECC; slots 1, 3, 5, 8, 10 and 12 populated on each CPU socket |
| Power Supply Quantity and Rating (W): | None |
| Power Supply Details: | Shared |
| Disk Drive: | 1 x HPE Synergy 480 Gen10 M.2 FIO Adapter Board Kit (873165-B21); 1 x HPE 480GB SATA 6G Read Intensive M.2 2280 SSD (875498-B21) |
| Disk Controller: | 1 x HPE Smart Array S100i SR Gen10 |
| # and type of Network Interface Cards (NICs) Installed: | 1 x HPE Synergy 3820C 10/20Gb 2-port Converged Network Adapter (777430-B21) |
| NICs Enabled in Firmware / OS / Connected: | 2/1/1 |
| Network Speed (Mbit): | 10000 |
| Keyboard: | None |
| Mouse: | None |
| Monitor: | None |
| Optical Drives: | No |
| Other Hardware: | None |
| Software | |
|---|---|
| Power Management: | Enabled (see SUT Notes) |
| Operating System (OS): | Windows Server 2012 R2 Datacenter |
| OS Version: | 6.3 (Build 9600) |
| Filesystem: | NTFS |
| JVM Vendor: | Oracle Corporation |
| JVM Version: | Java HotSpot(TM) 64-Bit Server VM (build 24.80-b11, mixed mode), version 1.7.0_80 |
| JVM Command-line Options: | -server -Xmn19g -Xms21g -Xmx21g -XX:SurvivorRatio=1 -XX:TargetSurvivorRatio=99 -XX:ParallelGCThreads=28 -XX:AllocatePrefetchDistance=256 -XX:AllocatePrefetchLines=4 -XX:LoopUnrollLimit=45 -XX:InitialTenuringThreshold=12 -XX:MaxTenuringThreshold=15 -XX:InlineSmallCode=9000 -XX:MaxInlineSize=270 -XX:FreqInlineSize=6000 -XX:+UseLargePages -XX:+UseParallelOldGC -XX:+AggressiveOpts |
| JVM Affinity: | start /NODE [0,1,2,3] /AFFINITY [0xFFFFFFF] |
| JVM Instances: | 4 |
| JVM Initial Heap (MB): | 21000 |
| JVM Maximum Heap (MB): | 21000 |
| JVM Address Bits: | 64 |
| Boot Firmware Version: | I42 v1.32 (02/01/2018) |
| Management Firmware Version: | 1.15 Aug 17 2017 |
| Workload Version: | SSJ 1.2.10 |
| Director Location: | Controller |
| Other Software: | HPE Composer Version 3.10.07 (HPE OneView) with HPE Synergy Custom SPP Bundle 2017.10.20180323; Microsoft Windows KB4054519, KB4056898 |
| JVM Instance | ssj_ops@100% |
|---|---|
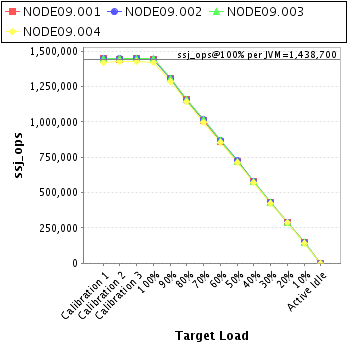
| NODE09.001 | 1,444,049 |
| NODE09.002 | 1,444,151 |
| NODE09.003 | 1,448,197 |
| NODE09.004 | 1,418,403 |
| ssj_ops@100% | 5,754,801 |
| ssj_ops@100% per JVM | 1,438,700 |
| Target Load | Actual Load | ssj_ops | |
|---|---|---|---|
| Target | Actual | ||
| Calibration 1 | 1,450,466 | ||
| Calibration 2 | 1,443,465 | ||
| Calibration 3 | 1,449,845 | ||
| ssj_ops@calibrated=1,446,655 | |||
| 100% | 99.8% | 1,446,655 | 1,444,049 |
| 90% | 90.2% | 1,301,989 | 1,304,784 |
| 80% | 80.3% | 1,157,324 | 1,161,489 |
| 70% | 70.0% | 1,012,658 | 1,012,478 |
| 60% | 59.7% | 867,993 | 864,322 |
| 50% | 50.0% | 723,327 | 722,620 |
| 40% | 40.2% | 578,662 | 580,923 |
| 30% | 29.9% | 433,996 | 432,835 |
| 20% | 20.0% | 289,331 | 289,436 |
| 10% | 10.0% | 144,665 | 144,713 |
| Active Idle | 0 | 0 | |

| Target Load | Actual Load | ssj_ops | |
|---|---|---|---|
| Target | Actual | ||
| Calibration 1 | 1,447,224 | ||
| Calibration 2 | 1,445,702 | ||
| Calibration 3 | 1,451,004 | ||
| ssj_ops@calibrated=1,448,353 | |||
| 100% | 99.7% | 1,448,353 | 1,444,151 |
| 90% | 90.0% | 1,303,518 | 1,304,148 |
| 80% | 79.7% | 1,158,683 | 1,154,418 |
| 70% | 70.0% | 1,013,847 | 1,014,158 |
| 60% | 59.9% | 869,012 | 867,310 |
| 50% | 50.0% | 724,177 | 723,546 |
| 40% | 39.8% | 579,341 | 576,370 |
| 30% | 29.9% | 434,506 | 432,453 |
| 20% | 20.1% | 289,671 | 290,797 |
| 10% | 10.0% | 144,835 | 144,339 |
| Active Idle | 0 | 0 | |
| Target Load | Actual Load | ssj_ops | |
|---|---|---|---|
| Target | Actual | ||
| Calibration 1 | 1,445,898 | ||
| Calibration 2 | 1,447,980 | ||
| Calibration 3 | 1,449,174 | ||
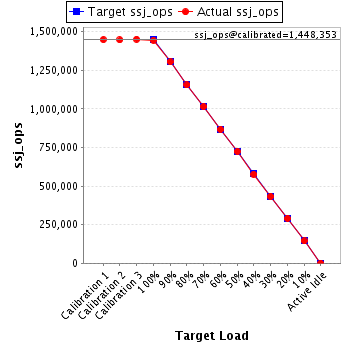
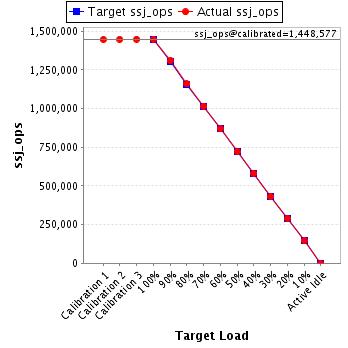
| ssj_ops@calibrated=1,448,577 | |||
| 100% | 100.0% | 1,448,577 | 1,448,197 |
| 90% | 90.4% | 1,303,719 | 1,309,597 |
| 80% | 80.0% | 1,158,861 | 1,159,272 |
| 70% | 70.2% | 1,014,004 | 1,016,850 |
| 60% | 60.0% | 869,146 | 868,520 |
| 50% | 49.9% | 724,288 | 722,696 |
| 40% | 40.1% | 579,431 | 580,874 |
| 30% | 29.9% | 434,573 | 432,852 |
| 20% | 20.0% | 289,715 | 289,781 |
| 10% | 10.1% | 144,858 | 146,945 |
| Active Idle | 0 | 0 | |
| Target Load | Actual Load | ssj_ops | |
|---|---|---|---|
| Target | Actual | ||
| Calibration 1 | 1,420,732 | ||
| Calibration 2 | 1,424,133 | ||
| Calibration 3 | 1,426,124 | ||
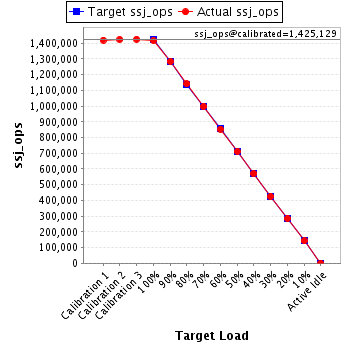
| ssj_ops@calibrated=1,425,129 | |||
| 100% | 99.5% | 1,425,129 | 1,418,403 |
| 90% | 90.1% | 1,282,616 | 1,284,515 |
| 80% | 80.2% | 1,140,103 | 1,142,361 |
| 70% | 70.1% | 997,590 | 998,500 |
| 60% | 59.9% | 855,077 | 854,038 |
| 50% | 49.9% | 712,564 | 711,672 |
| 40% | 40.0% | 570,051 | 569,533 |
| 30% | 29.9% | 427,539 | 425,451 |
| 20% | 20.0% | 285,026 | 285,574 |
| 10% | 10.0% | 142,513 | 142,247 |
| Active Idle | 0 | 0 | |