SPECpower_ssj2008
Host 'NODE06' Performance Report
Copyright © 2007-2018 Standard Performance Evaluation Corporation
| Hewlett Packard Enterprise Synergy 480 Gen10 Compute Module | ssj_ops@100% = 5,730,461 ssj_ops@100% per JVM = 1,432,615 |
||||
| Test Sponsor: | Hewlett Packard Enterprise | SPEC License #: | 3 | Test Method: | Multi Node |
| Tested By: | Hewlett Packard Enterprise | Test Location: | Houston, TX, USA | Test Date: | Aug 26, 2018 |
| Hardware Availability: | Jun-2018 | Software Availability: | Mar-2018 | Publication: | Sep 12, 2018 |
| System Source: | Single Supplier | System Designation: | Server | Power Provisioning: | Line-powered |
| Target Load | Actual Load | ssj_ops | |
|---|---|---|---|
| Target | Actual | ||
| Calibration 1 | 5,743,792 | ||
| Calibration 2 | 5,740,566 | ||
| Calibration 3 | 5,755,293 | ||
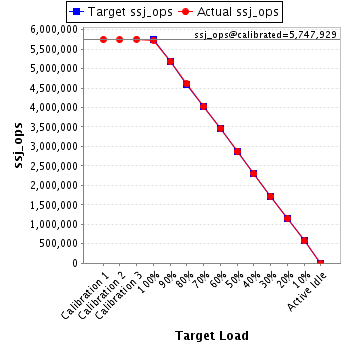
| ssj_ops@calibrated=5,747,929 | |||
| 100% | 99.7% | 5,747,929 | 5,730,461 |
| 90% | 90.0% | 5,173,136 | 5,175,230 |
| 80% | 80.1% | 4,598,343 | 4,604,997 |
| 70% | 70.0% | 4,023,550 | 4,024,658 |
| 60% | 60.1% | 3,448,758 | 3,454,001 |
| 50% | 49.9% | 2,873,965 | 2,870,386 |
| 40% | 40.0% | 2,299,172 | 2,299,220 |
| 30% | 30.0% | 1,724,379 | 1,724,511 |
| 20% | 20.0% | 1,149,586 | 1,152,197 |
| 10% | 10.0% | 574,793 | 574,863 |
| Active Idle | 0 | 0 | |
| Set Identifier: | SUT |
| Set Description: | System Under Test |
| # of Identical Nodes: | 9 |
| Comment: | SUT |
| Hardware | |
|---|---|
| Hardware Vendor: | Hewlett Packard Enterprise |
| Model: | Synergy 480 Gen10 Compute Module |
| Form Factor: | Other |
| CPU Name: | Intel Xeon Platinum 8180 2.50GHz |
| CPU Characteristics: | 28-Core, 2.50 GHz, 38.5 MB L3 Cache |
| CPU Frequency (MHz): | 2500 |
| CPU(s) Enabled: | 56 cores, 2 chips, 28 cores/chip |
| Hardware Threads: | 112 (2 / core) |
| CPU(s) Orderable: | 1,2 chips |
| Primary Cache: | 32 KB I + 32 KB D on chip per core |
| Secondary Cache: | 1 MB I+D on chip per core |
| Tertiary Cache: | 39424 KB I+D on chip per chip |
| Other Cache: | None |
| Memory Amount (GB): | 192 |
| # and size of DIMM: | 12 x 16384 MB |
| Memory Details: | 12 x 16GB 2Rx8 PC4-2666-V ECC; slots 1, 3, 5, 8, 10 and 12 populated on each CPU socket |
| Power Supply Quantity and Rating (W): | None |
| Power Supply Details: | Shared |
| Disk Drive: | 1 x HPE Synergy 480 Gen10 M.2 FIO Adapter Board Kit (873165-B21); 1 x HPE 480GB SATA 6G Read Intensive M.2 2280 SSD (875498-B21) |
| Disk Controller: | 1 x HPE Smart Array S100i SR Gen10 |
| # and type of Network Interface Cards (NICs) Installed: | 1 x HPE Synergy 3820C 10/20Gb 2-port Converged Network Adapter (777430-B21) |
| NICs Enabled in Firmware / OS / Connected: | 2/1/1 |
| Network Speed (Mbit): | 10000 |
| Keyboard: | None |
| Mouse: | None |
| Monitor: | None |
| Optical Drives: | No |
| Other Hardware: | None |
| Software | |
|---|---|
| Power Management: | Enabled (see SUT Notes) |
| Operating System (OS): | Windows Server 2012 R2 Datacenter |
| OS Version: | 6.3 (Build 9600) |
| Filesystem: | NTFS |
| JVM Vendor: | Oracle Corporation |
| JVM Version: | Java HotSpot(TM) 64-Bit Server VM (build 24.80-b11, mixed mode), version 1.7.0_80 |
| JVM Command-line Options: | -server -Xmn19g -Xms21g -Xmx21g -XX:SurvivorRatio=1 -XX:TargetSurvivorRatio=99 -XX:ParallelGCThreads=28 -XX:AllocatePrefetchDistance=256 -XX:AllocatePrefetchLines=4 -XX:LoopUnrollLimit=45 -XX:InitialTenuringThreshold=12 -XX:MaxTenuringThreshold=15 -XX:InlineSmallCode=9000 -XX:MaxInlineSize=270 -XX:FreqInlineSize=6000 -XX:+UseLargePages -XX:+UseParallelOldGC -XX:+AggressiveOpts |
| JVM Affinity: | start /NODE [0,1,2,3] /AFFINITY [0xFFFFFFF] |
| JVM Instances: | 4 |
| JVM Initial Heap (MB): | 21000 |
| JVM Maximum Heap (MB): | 21000 |
| JVM Address Bits: | 64 |
| Boot Firmware Version: | I42 v1.32 (02/01/2018) |
| Management Firmware Version: | 1.15 Aug 17 2017 |
| Workload Version: | SSJ 1.2.10 |
| Director Location: | Controller |
| Other Software: | HPE Composer Version 3.10.07 (HPE OneView) with HPE Synergy Custom SPP Bundle 2017.10.20180323; Microsoft Windows KB4054519, KB4056898 |
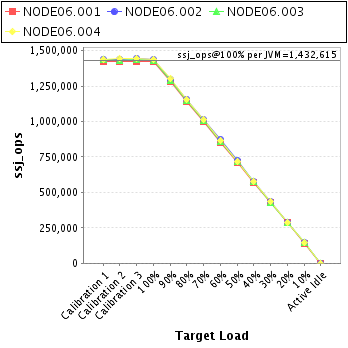
| JVM Instance | ssj_ops@100% |
|---|---|
| NODE06.001 | 1,421,842 |
| NODE06.002 | 1,439,328 |
| NODE06.003 | 1,431,357 |
| NODE06.004 | 1,437,933 |
| ssj_ops@100% | 5,730,461 |
| ssj_ops@100% per JVM | 1,432,615 |
| Target Load | Actual Load | ssj_ops | |
|---|---|---|---|
| Target | Actual | ||
| Calibration 1 | 1,425,471 | ||
| Calibration 2 | 1,423,871 | ||
| Calibration 3 | 1,425,877 | ||
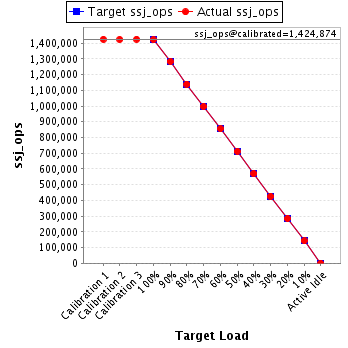
| ssj_ops@calibrated=1,424,874 | |||
| 100% | 99.8% | 1,424,874 | 1,421,842 |
| 90% | 90.1% | 1,282,386 | 1,283,386 |
| 80% | 80.0% | 1,139,899 | 1,139,455 |
| 70% | 70.0% | 997,412 | 998,091 |
| 60% | 60.0% | 854,924 | 854,831 |
| 50% | 50.0% | 712,437 | 712,558 |
| 40% | 40.0% | 569,949 | 569,560 |
| 30% | 29.9% | 427,462 | 426,605 |
| 20% | 19.9% | 284,975 | 284,172 |
| 10% | 10.0% | 142,487 | 142,271 |
| Active Idle | 0 | 0 | |
| Target Load | Actual Load | ssj_ops | |
|---|---|---|---|
| Target | Actual | ||
| Calibration 1 | 1,441,332 | ||
| Calibration 2 | 1,441,005 | ||
| Calibration 3 | 1,447,341 | ||
| ssj_ops@calibrated=1,444,173 | |||
| 100% | 99.7% | 1,444,173 | 1,439,328 |
| 90% | 90.0% | 1,299,756 | 1,299,280 |
| 80% | 80.2% | 1,155,338 | 1,158,460 |
| 70% | 70.0% | 1,010,921 | 1,011,064 |
| 60% | 60.2% | 866,504 | 869,956 |
| 50% | 50.1% | 722,086 | 723,677 |
| 40% | 40.0% | 577,669 | 577,023 |
| 30% | 29.9% | 433,252 | 432,361 |
| 20% | 20.0% | 288,835 | 289,200 |
| 10% | 10.0% | 144,417 | 144,850 |
| Active Idle | 0 | 0 | |

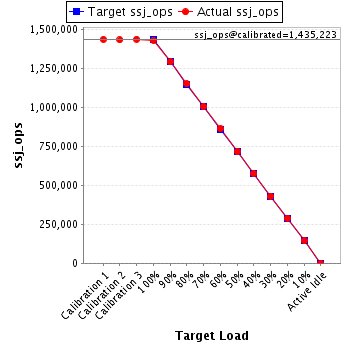
| Target Load | Actual Load | ssj_ops | |
|---|---|---|---|
| Target | Actual | ||
| Calibration 1 | 1,435,661 | ||
| Calibration 2 | 1,433,057 | ||
| Calibration 3 | 1,437,390 | ||
| ssj_ops@calibrated=1,435,223 | |||
| 100% | 99.7% | 1,435,223 | 1,431,357 |
| 90% | 90.0% | 1,291,701 | 1,291,300 |
| 80% | 80.2% | 1,148,179 | 1,151,552 |
| 70% | 70.0% | 1,004,656 | 1,004,326 |
| 60% | 60.1% | 861,134 | 862,658 |
| 50% | 49.9% | 717,612 | 716,394 |
| 40% | 40.0% | 574,089 | 574,680 |
| 30% | 30.0% | 430,567 | 430,424 |
| 20% | 20.2% | 287,045 | 289,211 |
| 10% | 10.0% | 143,522 | 143,852 |
| Active Idle | 0 | 0 | |
| Target Load | Actual Load | ssj_ops | |
|---|---|---|---|
| Target | Actual | ||
| Calibration 1 | 1,441,327 | ||
| Calibration 2 | 1,442,633 | ||
| Calibration 3 | 1,444,685 | ||
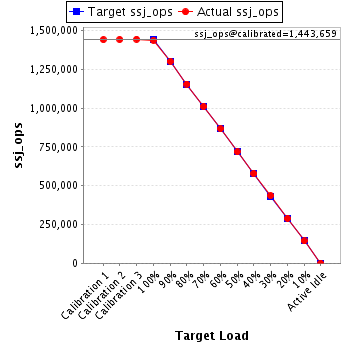
| ssj_ops@calibrated=1,443,659 | |||
| 100% | 99.6% | 1,443,659 | 1,437,933 |
| 90% | 90.1% | 1,299,293 | 1,301,263 |
| 80% | 80.0% | 1,154,928 | 1,155,531 |
| 70% | 70.0% | 1,010,562 | 1,011,177 |
| 60% | 60.0% | 866,196 | 866,557 |
| 50% | 49.7% | 721,830 | 717,757 |
| 40% | 40.0% | 577,464 | 577,956 |
| 30% | 30.1% | 433,098 | 435,121 |
| 20% | 20.1% | 288,732 | 289,614 |
| 10% | 10.0% | 144,366 | 143,890 |
| Active Idle | 0 | 0 | |