SPECpower_ssj2008
Host 'NODE05' Performance Report
Copyright © 2007-2018 Standard Performance Evaluation Corporation
| Hewlett Packard Enterprise Synergy 480 Gen10 Compute Module | ssj_ops@100% = 5,687,420 ssj_ops@100% per JVM = 1,421,855 |
||||
| Test Sponsor: | Hewlett Packard Enterprise | SPEC License #: | 3 | Test Method: | Multi Node |
| Tested By: | Hewlett Packard Enterprise | Test Location: | Houston, TX, USA | Test Date: | Aug 26, 2018 |
| Hardware Availability: | Jun-2018 | Software Availability: | Mar-2018 | Publication: | Sep 12, 2018 |
| System Source: | Single Supplier | System Designation: | Server | Power Provisioning: | Line-powered |
| Target Load | Actual Load | ssj_ops | |
|---|---|---|---|
| Target | Actual | ||
| Calibration 1 | 5,703,277 | ||
| Calibration 2 | 5,693,057 | ||
| Calibration 3 | 5,711,986 | ||
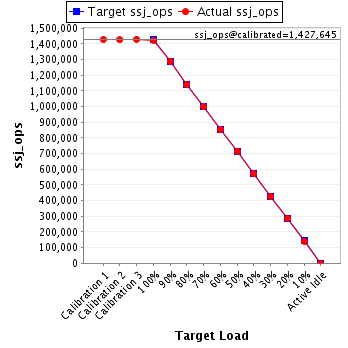
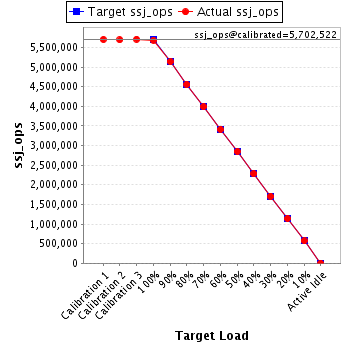
| ssj_ops@calibrated=5,702,522 | |||
| 100% | 99.7% | 5,702,522 | 5,687,420 |
| 90% | 90.1% | 5,132,269 | 5,139,661 |
| 80% | 79.9% | 4,562,017 | 4,558,552 |
| 70% | 69.9% | 3,991,765 | 3,988,171 |
| 60% | 59.9% | 3,421,513 | 3,415,776 |
| 50% | 50.0% | 2,851,261 | 2,849,869 |
| 40% | 40.0% | 2,281,009 | 2,279,284 |
| 30% | 29.9% | 1,710,756 | 1,707,413 |
| 20% | 20.0% | 1,140,504 | 1,138,267 |
| 10% | 10.0% | 570,252 | 569,412 |
| Active Idle | 0 | 0 | |
| Set Identifier: | SUT |
| Set Description: | System Under Test |
| # of Identical Nodes: | 9 |
| Comment: | SUT |
| Hardware | |
|---|---|
| Hardware Vendor: | Hewlett Packard Enterprise |
| Model: | Synergy 480 Gen10 Compute Module |
| Form Factor: | Other |
| CPU Name: | Intel Xeon Platinum 8180 2.50GHz |
| CPU Characteristics: | 28-Core, 2.50 GHz, 38.5 MB L3 Cache |
| CPU Frequency (MHz): | 2500 |
| CPU(s) Enabled: | 56 cores, 2 chips, 28 cores/chip |
| Hardware Threads: | 112 (2 / core) |
| CPU(s) Orderable: | 1,2 chips |
| Primary Cache: | 32 KB I + 32 KB D on chip per core |
| Secondary Cache: | 1 MB I+D on chip per core |
| Tertiary Cache: | 39424 KB I+D on chip per chip |
| Other Cache: | None |
| Memory Amount (GB): | 192 |
| # and size of DIMM: | 12 x 16384 MB |
| Memory Details: | 12 x 16GB 2Rx8 PC4-2666-V ECC; slots 1, 3, 5, 8, 10 and 12 populated on each CPU socket |
| Power Supply Quantity and Rating (W): | None |
| Power Supply Details: | Shared |
| Disk Drive: | 1 x HPE Synergy 480 Gen10 M.2 FIO Adapter Board Kit (873165-B21); 1 x HPE 480GB SATA 6G Read Intensive M.2 2280 SSD (875498-B21) |
| Disk Controller: | 1 x HPE Smart Array S100i SR Gen10 |
| # and type of Network Interface Cards (NICs) Installed: | 1 x HPE Synergy 3820C 10/20Gb 2-port Converged Network Adapter (777430-B21) |
| NICs Enabled in Firmware / OS / Connected: | 2/1/1 |
| Network Speed (Mbit): | 10000 |
| Keyboard: | None |
| Mouse: | None |
| Monitor: | None |
| Optical Drives: | No |
| Other Hardware: | None |
| Software | |
|---|---|
| Power Management: | Enabled (see SUT Notes) |
| Operating System (OS): | Windows Server 2012 R2 Datacenter |
| OS Version: | 6.3 (Build 9600) |
| Filesystem: | NTFS |
| JVM Vendor: | Oracle Corporation |
| JVM Version: | Java HotSpot(TM) 64-Bit Server VM (build 24.80-b11, mixed mode), version 1.7.0_80 |
| JVM Command-line Options: | -server -Xmn19g -Xms21g -Xmx21g -XX:SurvivorRatio=1 -XX:TargetSurvivorRatio=99 -XX:ParallelGCThreads=28 -XX:AllocatePrefetchDistance=256 -XX:AllocatePrefetchLines=4 -XX:LoopUnrollLimit=45 -XX:InitialTenuringThreshold=12 -XX:MaxTenuringThreshold=15 -XX:InlineSmallCode=9000 -XX:MaxInlineSize=270 -XX:FreqInlineSize=6000 -XX:+UseLargePages -XX:+UseParallelOldGC -XX:+AggressiveOpts |
| JVM Affinity: | start /NODE [0,1,2,3] /AFFINITY [0xFFFFFFF] |
| JVM Instances: | 4 |
| JVM Initial Heap (MB): | 21000 |
| JVM Maximum Heap (MB): | 21000 |
| JVM Address Bits: | 64 |
| Boot Firmware Version: | I42 v1.32 (02/01/2018) |
| Management Firmware Version: | 1.15 Aug 17 2017 |
| Workload Version: | SSJ 1.2.10 |
| Director Location: | Controller |
| Other Software: | HPE Composer Version 3.10.07 (HPE OneView) with HPE Synergy Custom SPP Bundle 2017.10.20180323; Microsoft Windows KB4054519, KB4056898 |
| JVM Instance | ssj_ops@100% |
|---|---|
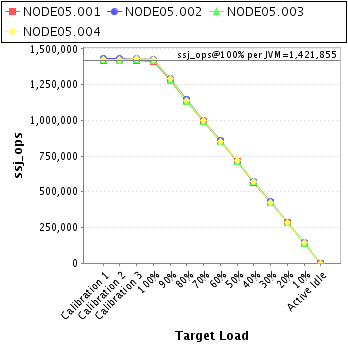
| NODE05.001 | 1,414,284 |
| NODE05.002 | 1,428,247 |
| NODE05.003 | 1,421,053 |
| NODE05.004 | 1,423,836 |
| ssj_ops@100% | 5,687,420 |
| ssj_ops@100% per JVM | 1,421,855 |
| Target Load | Actual Load | ssj_ops | |
|---|---|---|---|
| Target | Actual | ||
| Calibration 1 | 1,417,354 | ||
| Calibration 2 | 1,417,360 | ||
| Calibration 3 | 1,421,517 | ||
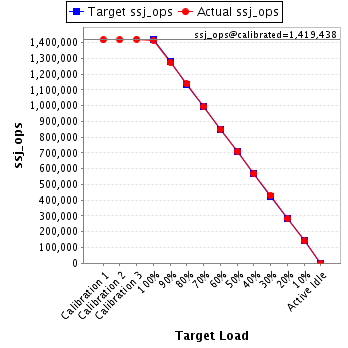
| ssj_ops@calibrated=1,419,438 | |||
| 100% | 99.6% | 1,419,438 | 1,414,284 |
| 90% | 89.9% | 1,277,495 | 1,275,728 |
| 80% | 80.1% | 1,135,551 | 1,137,192 |
| 70% | 70.0% | 993,607 | 994,245 |
| 60% | 59.9% | 851,663 | 850,645 |
| 50% | 50.0% | 709,719 | 709,397 |
| 40% | 40.0% | 567,775 | 567,130 |
| 30% | 30.1% | 425,832 | 427,591 |
| 20% | 19.9% | 283,888 | 283,080 |
| 10% | 10.0% | 141,944 | 141,515 |
| Active Idle | 0 | 0 | |
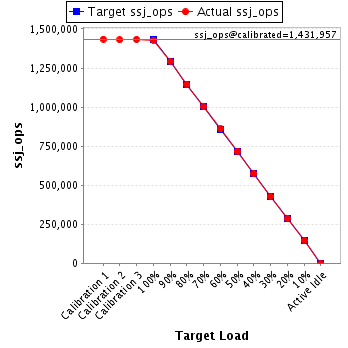
| Target Load | Actual Load | ssj_ops | |
|---|---|---|---|
| Target | Actual | ||
| Calibration 1 | 1,434,833 | ||
| Calibration 2 | 1,430,389 | ||
| Calibration 3 | 1,433,525 | ||
| ssj_ops@calibrated=1,431,957 | |||
| 100% | 99.7% | 1,431,957 | 1,428,247 |
| 90% | 90.3% | 1,288,761 | 1,292,551 |
| 80% | 80.1% | 1,145,565 | 1,147,417 |
| 70% | 69.9% | 1,002,370 | 1,000,997 |
| 60% | 60.1% | 859,174 | 860,488 |
| 50% | 50.0% | 715,978 | 715,349 |
| 40% | 40.0% | 572,783 | 572,813 |
| 30% | 30.0% | 429,587 | 429,100 |
| 20% | 20.0% | 286,391 | 285,980 |
| 10% | 10.1% | 143,196 | 144,957 |
| Active Idle | 0 | 0 | |
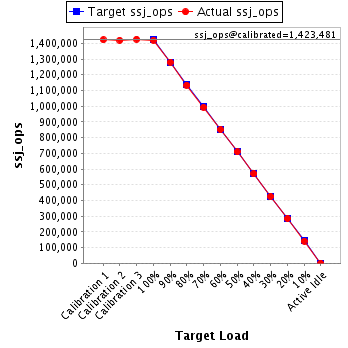
| Target Load | Actual Load | ssj_ops | |
|---|---|---|---|
| Target | Actual | ||
| Calibration 1 | 1,422,538 | ||
| Calibration 2 | 1,420,096 | ||
| Calibration 3 | 1,426,867 | ||
| ssj_ops@calibrated=1,423,481 | |||
| 100% | 99.8% | 1,423,481 | 1,421,053 |
| 90% | 90.0% | 1,281,133 | 1,281,081 |
| 80% | 79.7% | 1,138,785 | 1,134,531 |
| 70% | 69.9% | 996,437 | 994,414 |
| 60% | 59.8% | 854,089 | 850,716 |
| 50% | 49.8% | 711,741 | 709,085 |
| 40% | 40.0% | 569,392 | 569,035 |
| 30% | 29.9% | 427,044 | 425,343 |
| 20% | 19.9% | 284,696 | 283,872 |
| 10% | 9.9% | 142,348 | 141,098 |
| Active Idle | 0 | 0 | |
| Target Load | Actual Load | ssj_ops | |
|---|---|---|---|
| Target | Actual | ||
| Calibration 1 | 1,428,551 | ||
| Calibration 2 | 1,425,213 | ||
| Calibration 3 | 1,430,078 | ||
| ssj_ops@calibrated=1,427,645 | |||
| 100% | 99.7% | 1,427,645 | 1,423,836 |
| 90% | 90.4% | 1,284,881 | 1,290,300 |
| 80% | 79.8% | 1,142,116 | 1,139,412 |
| 70% | 69.9% | 999,352 | 998,516 |
| 60% | 59.8% | 856,587 | 853,927 |
| 50% | 50.2% | 713,823 | 716,038 |
| 40% | 39.9% | 571,058 | 570,306 |
| 30% | 29.8% | 428,294 | 425,379 |
| 20% | 20.0% | 285,529 | 285,336 |
| 10% | 9.9% | 142,765 | 141,843 |
| Active Idle | 0 | 0 | |