SPECpower_ssj2008
Host 'NODE04' Performance Report
Copyright © 2007-2018 Standard Performance Evaluation Corporation
| Hewlett Packard Enterprise Synergy 480 Gen10 Compute Module | ssj_ops@100% = 5,747,101 ssj_ops@100% per JVM = 1,436,775 |
||||
| Test Sponsor: | Hewlett Packard Enterprise | SPEC License #: | 3 | Test Method: | Multi Node |
| Tested By: | Hewlett Packard Enterprise | Test Location: | Houston, TX, USA | Test Date: | Aug 26, 2018 |
| Hardware Availability: | Jun-2018 | Software Availability: | Mar-2018 | Publication: | Sep 12, 2018 |
| System Source: | Single Supplier | System Designation: | Server | Power Provisioning: | Line-powered |
| Target Load | Actual Load | ssj_ops | |
|---|---|---|---|
| Target | Actual | ||
| Calibration 1 | 5,765,190 | ||
| Calibration 2 | 5,760,763 | ||
| Calibration 3 | 5,767,384 | ||
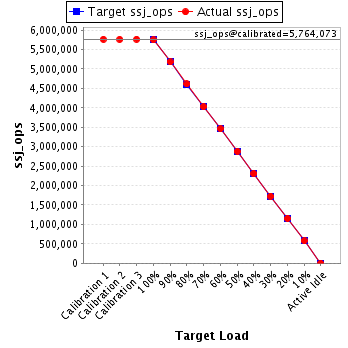
| ssj_ops@calibrated=5,764,073 | |||
| 100% | 99.7% | 5,764,073 | 5,747,101 |
| 90% | 89.9% | 5,187,666 | 5,180,753 |
| 80% | 80.0% | 4,611,259 | 4,614,091 |
| 70% | 69.9% | 4,034,851 | 4,028,596 |
| 60% | 60.0% | 3,458,444 | 3,459,072 |
| 50% | 50.0% | 2,882,037 | 2,881,098 |
| 40% | 40.0% | 2,305,629 | 2,303,485 |
| 30% | 30.0% | 1,729,222 | 1,727,590 |
| 20% | 20.0% | 1,152,815 | 1,152,416 |
| 10% | 10.0% | 576,407 | 575,413 |
| Active Idle | 0 | 0 | |
| Set Identifier: | SUT |
| Set Description: | System Under Test |
| # of Identical Nodes: | 9 |
| Comment: | SUT |
| Hardware | |
|---|---|
| Hardware Vendor: | Hewlett Packard Enterprise |
| Model: | Synergy 480 Gen10 Compute Module |
| Form Factor: | Other |
| CPU Name: | Intel Xeon Platinum 8180 2.50GHz |
| CPU Characteristics: | 28-Core, 2.50 GHz, 38.5 MB L3 Cache |
| CPU Frequency (MHz): | 2500 |
| CPU(s) Enabled: | 56 cores, 2 chips, 28 cores/chip |
| Hardware Threads: | 112 (2 / core) |
| CPU(s) Orderable: | 1,2 chips |
| Primary Cache: | 32 KB I + 32 KB D on chip per core |
| Secondary Cache: | 1 MB I+D on chip per core |
| Tertiary Cache: | 39424 KB I+D on chip per chip |
| Other Cache: | None |
| Memory Amount (GB): | 192 |
| # and size of DIMM: | 12 x 16384 MB |
| Memory Details: | 12 x 16GB 2Rx8 PC4-2666-V ECC; slots 1, 3, 5, 8, 10 and 12 populated on each CPU socket |
| Power Supply Quantity and Rating (W): | None |
| Power Supply Details: | Shared |
| Disk Drive: | 1 x HPE Synergy 480 Gen10 M.2 FIO Adapter Board Kit (873165-B21); 1 x HPE 480GB SATA 6G Read Intensive M.2 2280 SSD (875498-B21) |
| Disk Controller: | 1 x HPE Smart Array S100i SR Gen10 |
| # and type of Network Interface Cards (NICs) Installed: | 1 x HPE Synergy 3820C 10/20Gb 2-port Converged Network Adapter (777430-B21) |
| NICs Enabled in Firmware / OS / Connected: | 2/1/1 |
| Network Speed (Mbit): | 10000 |
| Keyboard: | None |
| Mouse: | None |
| Monitor: | None |
| Optical Drives: | No |
| Other Hardware: | None |
| Software | |
|---|---|
| Power Management: | Enabled (see SUT Notes) |
| Operating System (OS): | Windows Server 2012 R2 Datacenter |
| OS Version: | 6.3 (Build 9600) |
| Filesystem: | NTFS |
| JVM Vendor: | Oracle Corporation |
| JVM Version: | Java HotSpot(TM) 64-Bit Server VM (build 24.80-b11, mixed mode), version 1.7.0_80 |
| JVM Command-line Options: | -server -Xmn19g -Xms21g -Xmx21g -XX:SurvivorRatio=1 -XX:TargetSurvivorRatio=99 -XX:ParallelGCThreads=28 -XX:AllocatePrefetchDistance=256 -XX:AllocatePrefetchLines=4 -XX:LoopUnrollLimit=45 -XX:InitialTenuringThreshold=12 -XX:MaxTenuringThreshold=15 -XX:InlineSmallCode=9000 -XX:MaxInlineSize=270 -XX:FreqInlineSize=6000 -XX:+UseLargePages -XX:+UseParallelOldGC -XX:+AggressiveOpts |
| JVM Affinity: | start /NODE [0,1,2,3] /AFFINITY [0xFFFFFFF] |
| JVM Instances: | 4 |
| JVM Initial Heap (MB): | 21000 |
| JVM Maximum Heap (MB): | 21000 |
| JVM Address Bits: | 64 |
| Boot Firmware Version: | I42 v1.32 (02/01/2018) |
| Management Firmware Version: | 1.15 Aug 17 2017 |
| Workload Version: | SSJ 1.2.10 |
| Director Location: | Controller |
| Other Software: | HPE Composer Version 3.10.07 (HPE OneView) with HPE Synergy Custom SPP Bundle 2017.10.20180323; Microsoft Windows KB4054519, KB4056898 |
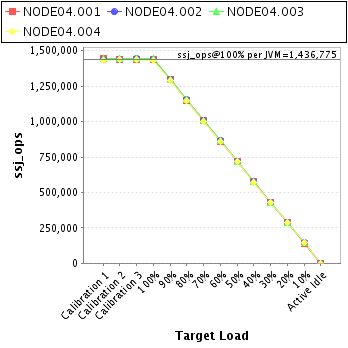
| JVM Instance | ssj_ops@100% |
|---|---|
| NODE04.001 | 1,437,216 |
| NODE04.002 | 1,435,817 |
| NODE04.003 | 1,443,039 |
| NODE04.004 | 1,431,029 |
| ssj_ops@100% | 5,747,101 |
| ssj_ops@100% per JVM | 1,436,775 |
| Target Load | Actual Load | ssj_ops | |
|---|---|---|---|
| Target | Actual | ||
| Calibration 1 | 1,443,314 | ||
| Calibration 2 | 1,441,483 | ||
| Calibration 3 | 1,440,667 | ||
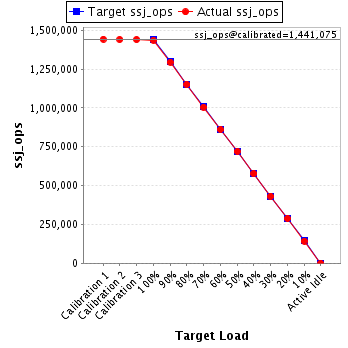
| ssj_ops@calibrated=1,441,075 | |||
| 100% | 99.7% | 1,441,075 | 1,437,216 |
| 90% | 89.9% | 1,296,967 | 1,295,563 |
| 80% | 80.0% | 1,152,860 | 1,152,534 |
| 70% | 69.8% | 1,008,752 | 1,006,387 |
| 60% | 59.8% | 864,645 | 862,389 |
| 50% | 50.0% | 720,537 | 720,607 |
| 40% | 40.0% | 576,430 | 576,733 |
| 30% | 30.0% | 432,322 | 432,245 |
| 20% | 20.0% | 288,215 | 288,649 |
| 10% | 9.9% | 144,107 | 142,850 |
| Active Idle | 0 | 0 | |
| Target Load | Actual Load | ssj_ops | |
|---|---|---|---|
| Target | Actual | ||
| Calibration 1 | 1,440,795 | ||
| Calibration 2 | 1,438,609 | ||
| Calibration 3 | 1,442,595 | ||
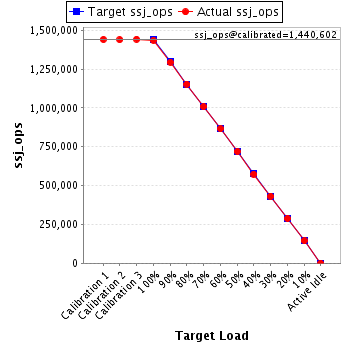
| ssj_ops@calibrated=1,440,602 | |||
| 100% | 99.7% | 1,440,602 | 1,435,817 |
| 90% | 89.8% | 1,296,542 | 1,294,231 |
| 80% | 80.1% | 1,152,482 | 1,153,542 |
| 70% | 70.0% | 1,008,421 | 1,008,275 |
| 60% | 60.0% | 864,361 | 864,852 |
| 50% | 50.0% | 720,301 | 719,722 |
| 40% | 39.8% | 576,241 | 573,903 |
| 30% | 30.0% | 432,181 | 432,474 |
| 20% | 20.0% | 288,120 | 287,920 |
| 10% | 10.0% | 144,060 | 144,650 |
| Active Idle | 0 | 0 | |
| Target Load | Actual Load | ssj_ops | |
|---|---|---|---|
| Target | Actual | ||
| Calibration 1 | 1,447,593 | ||
| Calibration 2 | 1,444,727 | ||
| Calibration 3 | 1,447,827 | ||
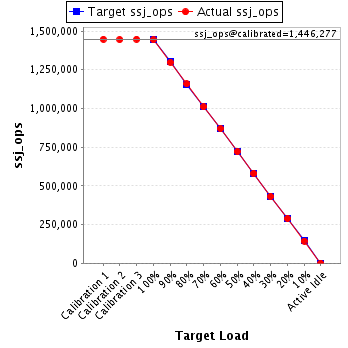
| ssj_ops@calibrated=1,446,277 | |||
| 100% | 99.8% | 1,446,277 | 1,443,039 |
| 90% | 89.8% | 1,301,649 | 1,298,161 |
| 80% | 80.1% | 1,157,021 | 1,158,582 |
| 70% | 69.9% | 1,012,394 | 1,010,389 |
| 60% | 60.1% | 867,766 | 869,310 |
| 50% | 49.9% | 723,138 | 721,452 |
| 40% | 40.1% | 578,511 | 579,603 |
| 30% | 29.8% | 433,883 | 431,602 |
| 20% | 19.9% | 289,255 | 288,254 |
| 10% | 9.9% | 144,628 | 143,704 |
| Active Idle | 0 | 0 | |
| Target Load | Actual Load | ssj_ops | |
|---|---|---|---|
| Target | Actual | ||
| Calibration 1 | 1,433,488 | ||
| Calibration 2 | 1,435,944 | ||
| Calibration 3 | 1,436,295 | ||
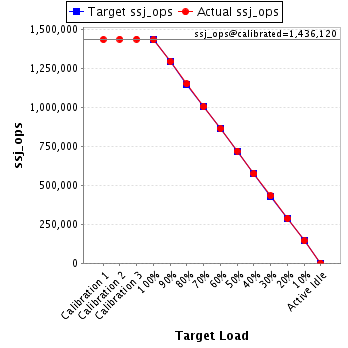
| ssj_ops@calibrated=1,436,120 | |||
| 100% | 99.6% | 1,436,120 | 1,431,029 |
| 90% | 90.0% | 1,292,508 | 1,292,798 |
| 80% | 80.0% | 1,148,896 | 1,149,432 |
| 70% | 69.9% | 1,005,284 | 1,003,546 |
| 60% | 60.1% | 861,672 | 862,522 |
| 50% | 50.1% | 718,060 | 719,317 |
| 40% | 39.9% | 574,448 | 573,247 |
| 30% | 30.0% | 430,836 | 431,268 |
| 20% | 20.0% | 287,224 | 287,593 |
| 10% | 10.0% | 143,612 | 144,209 |
| Active Idle | 0 | 0 | |