SPECpower_ssj2008
Host 'NODE02' Performance Report
Copyright © 2007-2018 Standard Performance Evaluation Corporation
| Hewlett Packard Enterprise Synergy 480 Gen10 Compute Module | ssj_ops@100% = 5,721,337 ssj_ops@100% per JVM = 1,430,334 |
||||
| Test Sponsor: | Hewlett Packard Enterprise | SPEC License #: | 3 | Test Method: | Multi Node |
| Tested By: | Hewlett Packard Enterprise | Test Location: | Houston, TX, USA | Test Date: | Aug 26, 2018 |
| Hardware Availability: | Jun-2018 | Software Availability: | Mar-2018 | Publication: | Sep 12, 2018 |
| System Source: | Single Supplier | System Designation: | Server | Power Provisioning: | Line-powered |
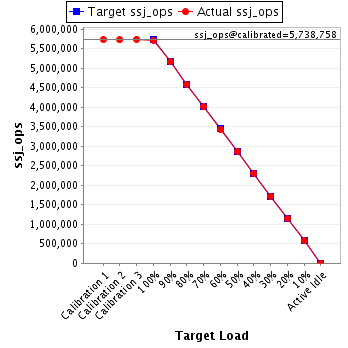
| Target Load | Actual Load | ssj_ops | |
|---|---|---|---|
| Target | Actual | ||
| Calibration 1 | 5,741,086 | ||
| Calibration 2 | 5,731,413 | ||
| Calibration 3 | 5,746,102 | ||
| ssj_ops@calibrated=5,738,758 | |||
| 100% | 99.7% | 5,738,758 | 5,721,337 |
| 90% | 89.9% | 5,164,882 | 5,161,327 |
| 80% | 79.9% | 4,591,006 | 4,583,151 |
| 70% | 70.1% | 4,017,130 | 4,020,501 |
| 60% | 59.9% | 3,443,255 | 3,436,789 |
| 50% | 50.0% | 2,869,379 | 2,867,551 |
| 40% | 40.0% | 2,295,503 | 2,297,007 |
| 30% | 30.0% | 1,721,627 | 1,722,182 |
| 20% | 20.0% | 1,147,752 | 1,146,971 |
| 10% | 10.0% | 573,876 | 573,313 |
| Active Idle | 0 | 0 | |
| Set Identifier: | SUT |
| Set Description: | System Under Test |
| # of Identical Nodes: | 9 |
| Comment: | SUT |
| Hardware | |
|---|---|
| Hardware Vendor: | Hewlett Packard Enterprise |
| Model: | Synergy 480 Gen10 Compute Module |
| Form Factor: | Other |
| CPU Name: | Intel Xeon Platinum 8180 2.50GHz |
| CPU Characteristics: | 28-Core, 2.50 GHz, 38.5 MB L3 Cache |
| CPU Frequency (MHz): | 2500 |
| CPU(s) Enabled: | 56 cores, 2 chips, 28 cores/chip |
| Hardware Threads: | 112 (2 / core) |
| CPU(s) Orderable: | 1,2 chips |
| Primary Cache: | 32 KB I + 32 KB D on chip per core |
| Secondary Cache: | 1 MB I+D on chip per core |
| Tertiary Cache: | 39424 KB I+D on chip per chip |
| Other Cache: | None |
| Memory Amount (GB): | 192 |
| # and size of DIMM: | 12 x 16384 MB |
| Memory Details: | 12 x 16GB 2Rx8 PC4-2666-V ECC; slots 1, 3, 5, 8, 10 and 12 populated on each CPU socket |
| Power Supply Quantity and Rating (W): | None |
| Power Supply Details: | Shared |
| Disk Drive: | 1 x HPE Synergy 480 Gen10 M.2 FIO Adapter Board Kit (873165-B21); 1 x HPE 480GB SATA 6G Read Intensive M.2 2280 SSD (875498-B21) |
| Disk Controller: | 1 x HPE Smart Array S100i SR Gen10 |
| # and type of Network Interface Cards (NICs) Installed: | 1 x HPE Synergy 3820C 10/20Gb 2-port Converged Network Adapter (777430-B21) |
| NICs Enabled in Firmware / OS / Connected: | 2/1/1 |
| Network Speed (Mbit): | 10000 |
| Keyboard: | None |
| Mouse: | None |
| Monitor: | None |
| Optical Drives: | No |
| Other Hardware: | None |
| Software | |
|---|---|
| Power Management: | Enabled (see SUT Notes) |
| Operating System (OS): | Windows Server 2012 R2 Datacenter |
| OS Version: | 6.3 (Build 9600) |
| Filesystem: | NTFS |
| JVM Vendor: | Oracle Corporation |
| JVM Version: | Java HotSpot(TM) 64-Bit Server VM (build 24.80-b11, mixed mode), version 1.7.0_80 |
| JVM Command-line Options: | -server -Xmn19g -Xms21g -Xmx21g -XX:SurvivorRatio=1 -XX:TargetSurvivorRatio=99 -XX:ParallelGCThreads=28 -XX:AllocatePrefetchDistance=256 -XX:AllocatePrefetchLines=4 -XX:LoopUnrollLimit=45 -XX:InitialTenuringThreshold=12 -XX:MaxTenuringThreshold=15 -XX:InlineSmallCode=9000 -XX:MaxInlineSize=270 -XX:FreqInlineSize=6000 -XX:+UseLargePages -XX:+UseParallelOldGC -XX:+AggressiveOpts |
| JVM Affinity: | start /NODE [0,1,2,3] /AFFINITY [0xFFFFFFF] |
| JVM Instances: | 4 |
| JVM Initial Heap (MB): | 21000 |
| JVM Maximum Heap (MB): | 21000 |
| JVM Address Bits: | 64 |
| Boot Firmware Version: | I42 v1.32 (02/01/2018) |
| Management Firmware Version: | 1.15 Aug 17 2017 |
| Workload Version: | SSJ 1.2.10 |
| Director Location: | Controller |
| Other Software: | HPE Composer Version 3.10.07 (HPE OneView) with HPE Synergy Custom SPP Bundle 2017.10.20180323; Microsoft Windows KB4054519, KB4056898 |
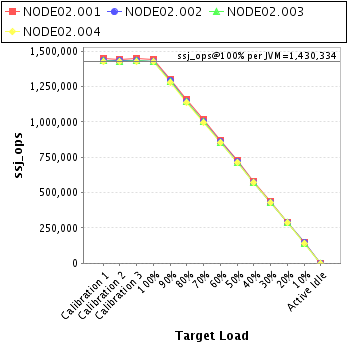
| JVM Instance | ssj_ops@100% |
|---|---|
| NODE02.001 | 1,442,748 |
| NODE02.002 | 1,429,697 |
| NODE02.003 | 1,424,798 |
| NODE02.004 | 1,424,095 |
| ssj_ops@100% | 5,721,337 |
| ssj_ops@100% per JVM | 1,430,334 |
| Target Load | Actual Load | ssj_ops | |
|---|---|---|---|
| Target | Actual | ||
| Calibration 1 | 1,447,834 | ||
| Calibration 2 | 1,444,653 | ||
| Calibration 3 | 1,450,673 | ||
| ssj_ops@calibrated=1,447,663 | |||
| 100% | 99.7% | 1,447,663 | 1,442,748 |
| 90% | 89.8% | 1,302,896 | 1,300,422 |
| 80% | 79.9% | 1,158,130 | 1,156,127 |
| 70% | 70.2% | 1,013,364 | 1,016,650 |
| 60% | 60.0% | 868,598 | 868,294 |
| 50% | 50.0% | 723,831 | 723,547 |
| 40% | 40.0% | 579,065 | 579,561 |
| 30% | 30.1% | 434,299 | 436,288 |
| 20% | 19.9% | 289,533 | 288,795 |
| 10% | 10.0% | 144,766 | 144,580 |
| Active Idle | 0 | 0 | |

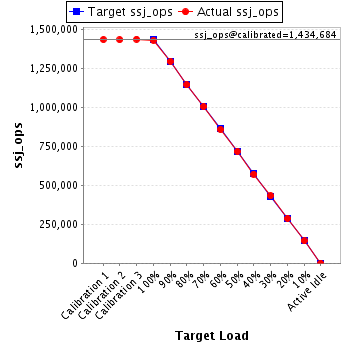
| Target Load | Actual Load | ssj_ops | |
|---|---|---|---|
| Target | Actual | ||
| Calibration 1 | 1,434,194 | ||
| Calibration 2 | 1,432,637 | ||
| Calibration 3 | 1,436,732 | ||
| ssj_ops@calibrated=1,434,684 | |||
| 100% | 99.7% | 1,434,684 | 1,429,697 |
| 90% | 90.2% | 1,291,216 | 1,294,147 |
| 80% | 79.8% | 1,147,747 | 1,144,608 |
| 70% | 70.0% | 1,004,279 | 1,004,653 |
| 60% | 59.8% | 860,811 | 857,896 |
| 50% | 50.0% | 717,342 | 716,655 |
| 40% | 39.8% | 573,874 | 571,525 |
| 30% | 30.1% | 430,405 | 431,685 |
| 20% | 20.0% | 286,937 | 286,815 |
| 10% | 10.0% | 143,468 | 143,724 |
| Active Idle | 0 | 0 | |
| Target Load | Actual Load | ssj_ops | |
|---|---|---|---|
| Target | Actual | ||
| Calibration 1 | 1,433,475 | ||
| Calibration 2 | 1,429,006 | ||
| Calibration 3 | 1,431,016 | ||
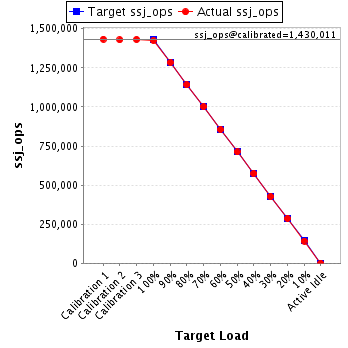
| ssj_ops@calibrated=1,430,011 | |||
| 100% | 99.6% | 1,430,011 | 1,424,798 |
| 90% | 89.9% | 1,287,010 | 1,284,982 |
| 80% | 79.9% | 1,144,009 | 1,142,291 |
| 70% | 70.1% | 1,001,008 | 1,001,893 |
| 60% | 59.8% | 858,007 | 855,815 |
| 50% | 49.8% | 715,006 | 711,817 |
| 40% | 40.1% | 572,004 | 573,225 |
| 30% | 29.8% | 429,003 | 426,363 |
| 20% | 20.0% | 286,002 | 285,980 |
| 10% | 10.0% | 143,001 | 142,288 |
| Active Idle | 0 | 0 | |
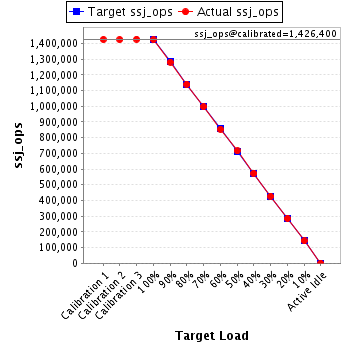
| Target Load | Actual Load | ssj_ops | |
|---|---|---|---|
| Target | Actual | ||
| Calibration 1 | 1,425,583 | ||
| Calibration 2 | 1,425,118 | ||
| Calibration 3 | 1,427,682 | ||
| ssj_ops@calibrated=1,426,400 | |||
| 100% | 99.8% | 1,426,400 | 1,424,095 |
| 90% | 89.9% | 1,283,760 | 1,281,777 |
| 80% | 79.9% | 1,141,120 | 1,140,124 |
| 70% | 69.9% | 998,480 | 997,305 |
| 60% | 59.9% | 855,840 | 854,784 |
| 50% | 50.2% | 713,200 | 715,532 |
| 40% | 40.1% | 570,560 | 572,696 |
| 30% | 30.0% | 427,920 | 427,846 |
| 20% | 20.0% | 285,280 | 285,380 |
| 10% | 10.0% | 142,640 | 142,720 |
| Active Idle | 0 | 0 | |