SPECpower_ssj2008
Host 'NODE01' Performance Report
Copyright © 2007-2018 Standard Performance Evaluation Corporation
| Hewlett Packard Enterprise Synergy 480 Gen10 Compute Module | ssj_ops@100% = 5,756,094 ssj_ops@100% per JVM = 1,439,023 |
||||
| Test Sponsor: | Hewlett Packard Enterprise | SPEC License #: | 3 | Test Method: | Multi Node |
| Tested By: | Hewlett Packard Enterprise | Test Location: | Houston, TX, USA | Test Date: | Aug 26, 2018 |
| Hardware Availability: | Jun-2018 | Software Availability: | Mar-2018 | Publication: | Sep 12, 2018 |
| System Source: | Single Supplier | System Designation: | Server | Power Provisioning: | Line-powered |
| Target Load | Actual Load | ssj_ops | |
|---|---|---|---|
| Target | Actual | ||
| Calibration 1 | 5,777,214 | ||
| Calibration 2 | 5,771,210 | ||
| Calibration 3 | 5,774,369 | ||
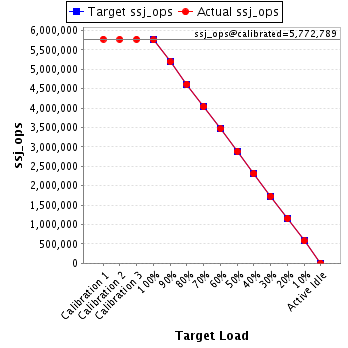
| ssj_ops@calibrated=5,772,789 | |||
| 100% | 99.7% | 5,772,789 | 5,756,094 |
| 90% | 90.0% | 5,195,510 | 5,195,490 |
| 80% | 80.0% | 4,618,231 | 4,616,323 |
| 70% | 69.9% | 4,040,953 | 4,037,051 |
| 60% | 60.0% | 3,463,674 | 3,464,672 |
| 50% | 50.0% | 2,886,395 | 2,884,614 |
| 40% | 40.0% | 2,309,116 | 2,308,463 |
| 30% | 30.0% | 1,731,837 | 1,732,257 |
| 20% | 20.0% | 1,154,558 | 1,155,921 |
| 10% | 10.0% | 577,279 | 576,342 |
| Active Idle | 0 | 0 | |
| Set Identifier: | SUT |
| Set Description: | System Under Test |
| # of Identical Nodes: | 9 |
| Comment: | SUT |
| Hardware | |
|---|---|
| Hardware Vendor: | Hewlett Packard Enterprise |
| Model: | Synergy 480 Gen10 Compute Module |
| Form Factor: | Other |
| CPU Name: | Intel Xeon Platinum 8180 2.50GHz |
| CPU Characteristics: | 28-Core, 2.50 GHz, 38.5 MB L3 Cache |
| CPU Frequency (MHz): | 2500 |
| CPU(s) Enabled: | 56 cores, 2 chips, 28 cores/chip |
| Hardware Threads: | 112 (2 / core) |
| CPU(s) Orderable: | 1,2 chips |
| Primary Cache: | 32 KB I + 32 KB D on chip per core |
| Secondary Cache: | 1 MB I+D on chip per core |
| Tertiary Cache: | 39424 KB I+D on chip per chip |
| Other Cache: | None |
| Memory Amount (GB): | 192 |
| # and size of DIMM: | 12 x 16384 MB |
| Memory Details: | 12 x 16GB 2Rx8 PC4-2666-V ECC; slots 1, 3, 5, 8, 10 and 12 populated on each CPU socket |
| Power Supply Quantity and Rating (W): | None |
| Power Supply Details: | Shared |
| Disk Drive: | 1 x HPE Synergy 480 Gen10 M.2 FIO Adapter Board Kit (873165-B21); 1 x HPE 480GB SATA 6G Read Intensive M.2 2280 SSD (875498-B21) |
| Disk Controller: | 1 x HPE Smart Array S100i SR Gen10 |
| # and type of Network Interface Cards (NICs) Installed: | 1 x HPE Synergy 3820C 10/20Gb 2-port Converged Network Adapter (777430-B21) |
| NICs Enabled in Firmware / OS / Connected: | 2/1/1 |
| Network Speed (Mbit): | 10000 |
| Keyboard: | None |
| Mouse: | None |
| Monitor: | None |
| Optical Drives: | No |
| Other Hardware: | None |
| Software | |
|---|---|
| Power Management: | Enabled (see SUT Notes) |
| Operating System (OS): | Windows Server 2012 R2 Datacenter |
| OS Version: | 6.3 (Build 9600) |
| Filesystem: | NTFS |
| JVM Vendor: | Oracle Corporation |
| JVM Version: | Java HotSpot(TM) 64-Bit Server VM (build 24.80-b11, mixed mode), version 1.7.0_80 |
| JVM Command-line Options: | -server -Xmn19g -Xms21g -Xmx21g -XX:SurvivorRatio=1 -XX:TargetSurvivorRatio=99 -XX:ParallelGCThreads=28 -XX:AllocatePrefetchDistance=256 -XX:AllocatePrefetchLines=4 -XX:LoopUnrollLimit=45 -XX:InitialTenuringThreshold=12 -XX:MaxTenuringThreshold=15 -XX:InlineSmallCode=9000 -XX:MaxInlineSize=270 -XX:FreqInlineSize=6000 -XX:+UseLargePages -XX:+UseParallelOldGC -XX:+AggressiveOpts |
| JVM Affinity: | start /NODE [0,1,2,3] /AFFINITY [0xFFFFFFF] |
| JVM Instances: | 4 |
| JVM Initial Heap (MB): | 21000 |
| JVM Maximum Heap (MB): | 21000 |
| JVM Address Bits: | 64 |
| Boot Firmware Version: | I42 v1.32 (02/01/2018) |
| Management Firmware Version: | 1.15 Aug 17 2017 |
| Workload Version: | SSJ 1.2.10 |
| Director Location: | Controller |
| Other Software: | HPE Composer Version 3.10.07 (HPE OneView) with HPE Synergy Custom SPP Bundle 2017.10.20180323; Microsoft Windows KB4054519, KB4056898 |
| JVM Instance | ssj_ops@100% |
|---|---|
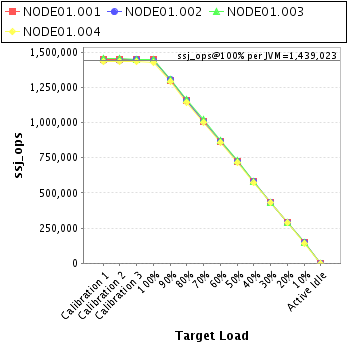
| NODE01.001 | 1,443,915 |
| NODE01.002 | 1,440,418 |
| NODE01.003 | 1,445,866 |
| NODE01.004 | 1,425,894 |
| ssj_ops@100% | 5,756,094 |
| ssj_ops@100% per JVM | 1,439,023 |
| Target Load | Actual Load | ssj_ops | |
|---|---|---|---|
| Target | Actual | ||
| Calibration 1 | 1,447,566 | ||
| Calibration 2 | 1,444,798 | ||
| Calibration 3 | 1,446,975 | ||
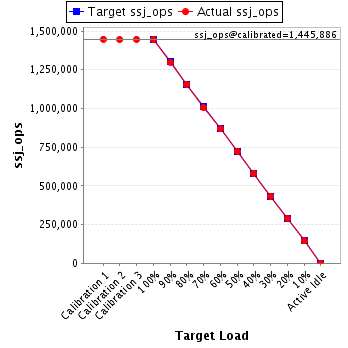
| ssj_ops@calibrated=1,445,886 | |||
| 100% | 99.9% | 1,445,886 | 1,443,915 |
| 90% | 89.8% | 1,301,298 | 1,299,127 |
| 80% | 79.9% | 1,156,709 | 1,155,705 |
| 70% | 69.6% | 1,012,120 | 1,006,794 |
| 60% | 60.0% | 867,532 | 867,710 |
| 50% | 50.0% | 722,943 | 723,662 |
| 40% | 40.1% | 578,354 | 579,473 |
| 30% | 30.0% | 433,766 | 434,145 |
| 20% | 20.0% | 289,177 | 289,825 |
| 10% | 10.0% | 144,589 | 144,073 |
| Active Idle | 0 | 0 | |
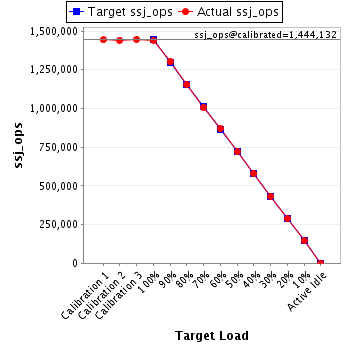
| Target Load | Actual Load | ssj_ops | |
|---|---|---|---|
| Target | Actual | ||
| Calibration 1 | 1,442,170 | ||
| Calibration 2 | 1,440,740 | ||
| Calibration 3 | 1,447,524 | ||
| ssj_ops@calibrated=1,444,132 | |||
| 100% | 99.7% | 1,444,132 | 1,440,418 |
| 90% | 90.1% | 1,299,718 | 1,301,788 |
| 80% | 79.9% | 1,155,305 | 1,154,165 |
| 70% | 69.8% | 1,010,892 | 1,007,948 |
| 60% | 60.1% | 866,479 | 868,244 |
| 50% | 49.9% | 722,066 | 720,037 |
| 40% | 40.1% | 577,653 | 578,935 |
| 30% | 30.0% | 433,239 | 433,945 |
| 20% | 19.9% | 288,826 | 288,085 |
| 10% | 10.0% | 144,413 | 144,823 |
| Active Idle | 0 | 0 | |
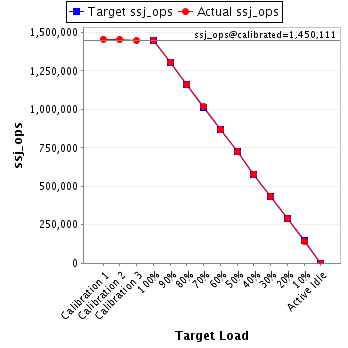
| Target Load | Actual Load | ssj_ops | |
|---|---|---|---|
| Target | Actual | ||
| Calibration 1 | 1,456,465 | ||
| Calibration 2 | 1,453,032 | ||
| Calibration 3 | 1,447,191 | ||
| ssj_ops@calibrated=1,450,111 | |||
| 100% | 99.7% | 1,450,111 | 1,445,866 |
| 90% | 89.9% | 1,305,100 | 1,303,990 |
| 80% | 80.2% | 1,160,089 | 1,162,325 |
| 70% | 70.3% | 1,015,078 | 1,019,543 |
| 60% | 59.9% | 870,067 | 868,912 |
| 50% | 50.1% | 725,056 | 726,355 |
| 40% | 40.0% | 580,044 | 579,841 |
| 30% | 29.9% | 435,033 | 433,523 |
| 20% | 20.1% | 290,022 | 291,878 |
| 10% | 9.9% | 145,011 | 144,064 |
| Active Idle | 0 | 0 | |
| Target Load | Actual Load | ssj_ops | |
|---|---|---|---|
| Target | Actual | ||
| Calibration 1 | 1,431,013 | ||
| Calibration 2 | 1,432,641 | ||
| Calibration 3 | 1,432,680 | ||
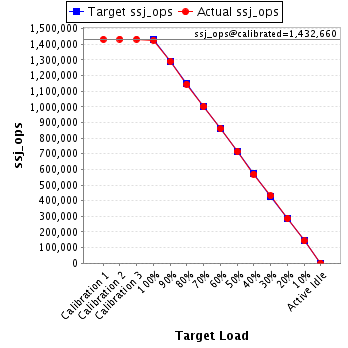
| ssj_ops@calibrated=1,432,660 | |||
| 100% | 99.5% | 1,432,660 | 1,425,894 |
| 90% | 90.1% | 1,289,394 | 1,290,585 |
| 80% | 79.9% | 1,146,128 | 1,144,128 |
| 70% | 70.0% | 1,002,862 | 1,002,766 |
| 60% | 60.0% | 859,596 | 859,807 |
| 50% | 49.9% | 716,330 | 714,560 |
| 40% | 39.8% | 573,064 | 570,214 |
| 30% | 30.1% | 429,798 | 430,644 |
| 20% | 20.0% | 286,532 | 286,133 |
| 10% | 10.0% | 143,266 | 143,382 |
| Active Idle | 0 | 0 | |