SPECpower_ssj2008
Host 'NODE10' Performance Report
Copyright © 2007-2018 Standard Performance Evaluation Corporation
| Hewlett Packard Enterprise Synergy 480 Gen10 Compute Module | ssj_ops@100% = 5,747,438 ssj_ops@100% per JVM = 1,436,859 |
||||
| Test Sponsor: | Hewlett Packard Enterprise | SPEC License #: | 3 | Test Method: | Multi Node |
| Tested By: | Hewlett Packard Enterprise | Test Location: | Houston, TX, USA | Test Date: | Aug 24, 2018 |
| Hardware Availability: | Jun-2018 | Software Availability: | Mar-2018 | Publication: | Sep 12, 2018 |
| System Source: | Single Supplier | System Designation: | Server | Power Provisioning: | Line-powered |
| Target Load | Actual Load | ssj_ops | |
|---|---|---|---|
| Target | Actual | ||
| Calibration 1 | 5,770,918 | ||
| Calibration 2 | 5,758,110 | ||
| Calibration 3 | 5,765,011 | ||
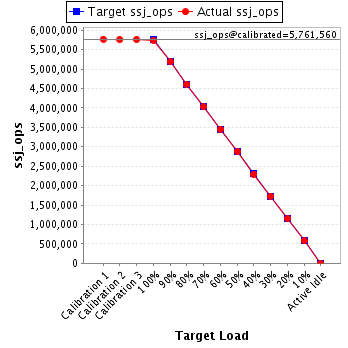
| ssj_ops@calibrated=5,761,560 | |||
| 100% | 99.8% | 5,761,560 | 5,747,438 |
| 90% | 90.0% | 5,185,404 | 5,188,027 |
| 80% | 80.0% | 4,609,248 | 4,609,517 |
| 70% | 70.0% | 4,033,092 | 4,030,502 |
| 60% | 60.0% | 3,456,936 | 3,455,300 |
| 50% | 49.9% | 2,880,780 | 2,876,184 |
| 40% | 39.9% | 2,304,624 | 2,297,587 |
| 30% | 30.0% | 1,728,468 | 1,730,276 |
| 20% | 20.0% | 1,152,312 | 1,153,863 |
| 10% | 10.0% | 576,156 | 575,891 |
| Active Idle | 0 | 0 | |
| Set Identifier: | SUT |
| Set Description: | System Under Test |
| # of Identical Nodes: | 10 |
| Comment: | SUT |
| Hardware | |
|---|---|
| Hardware Vendor: | Hewlett Packard Enterprise |
| Model: | Synergy 480 Gen10 Compute Module |
| Form Factor: | Other |
| CPU Name: | Intel Xeon Platinum 8180 2.50GHz |
| CPU Characteristics: | 28-Core, 2.50 GHz, 38.5 MB L3 Cache |
| CPU Frequency (MHz): | 2500 |
| CPU(s) Enabled: | 56 cores, 2 chips, 28 cores/chip |
| Hardware Threads: | 112 (2 / core) |
| CPU(s) Orderable: | 1,2 chips |
| Primary Cache: | 32 KB I + 32 KB D on chip per core |
| Secondary Cache: | 1 MB I+D on chip per core |
| Tertiary Cache: | 39424 KB I+D on chip per chip |
| Other Cache: | None |
| Memory Amount (GB): | 192 |
| # and size of DIMM: | 12 x 16384 MB |
| Memory Details: | 12 x 16GB 2Rx8 PC4-2666-V ECC; slots 1, 3, 5, 8, 10 and 12 populated on each CPU socket |
| Power Supply Quantity and Rating (W): | None |
| Power Supply Details: | Shared |
| Disk Drive: | 1 x HPE Synergy 480 Gen10 M.2 FIO Adapter Board Kit (873165-B21); 1 x HPE 480GB SATA 6G Read Intensive M.2 2280 SSD (875498-B21) |
| Disk Controller: | 1 x HPE Smart Array S100i SR Gen10 |
| # and type of Network Interface Cards (NICs) Installed: | 1 x HPE Synergy 3820C 10/20Gb 2-port Converged Network Adapter (777430-B21) |
| NICs Enabled in Firmware / OS / Connected: | 2/1/1 |
| Network Speed (Mbit): | 10000 |
| Keyboard: | None |
| Mouse: | None |
| Monitor: | None |
| Optical Drives: | No |
| Other Hardware: | None |
| Software | |
|---|---|
| Power Management: | Enabled (see SUT Notes) |
| Operating System (OS): | Windows Server 2012 R2 Datacenter |
| OS Version: | 6.3 (Build 9600) |
| Filesystem: | NTFS |
| JVM Vendor: | Oracle Corporation |
| JVM Version: | Java HotSpot(TM) 64-Bit Server VM (build 24.80-b11, mixed mode), version 1.7.0_80 |
| JVM Command-line Options: | -server -Xmn19g -Xms21g -Xmx21g -XX:SurvivorRatio=1 -XX:TargetSurvivorRatio=99 -XX:ParallelGCThreads=28 -XX:AllocatePrefetchDistance=256 -XX:AllocatePrefetchLines=4 -XX:LoopUnrollLimit=45 -XX:InitialTenuringThreshold=12 -XX:MaxTenuringThreshold=15 -XX:InlineSmallCode=9000 -XX:MaxInlineSize=270 -XX:FreqInlineSize=6000 -XX:+UseLargePages -XX:+UseParallelOldGC -XX:+AggressiveOpts |
| JVM Affinity: | start /NODE [0,1,2,3] /AFFINITY [0xFFFFFFF] |
| JVM Instances: | 4 |
| JVM Initial Heap (MB): | 21000 |
| JVM Maximum Heap (MB): | 21000 |
| JVM Address Bits: | 64 |
| Boot Firmware Version: | I42 v1.32 (02/01/2018) |
| Management Firmware Version: | 1.15 Aug 17 2017 |
| Workload Version: | SSJ 1.2.10 |
| Director Location: | Controller |
| Other Software: | HPE Composer Version 3.10.07 (HPE OneView) with HPE Synergy Custom SPP Bundle 2017.10.20180323; Microsoft Windows KB4054519, KB4056898 |
| JVM Instance | ssj_ops@100% |
|---|---|
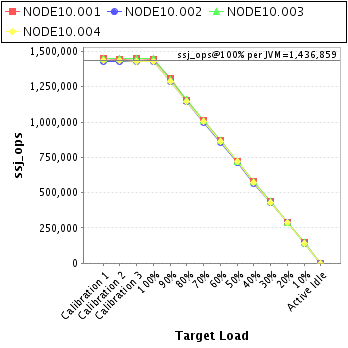
| NODE10.001 | 1,443,253 |
| NODE10.002 | 1,427,268 |
| NODE10.003 | 1,448,993 |
| NODE10.004 | 1,427,923 |
| ssj_ops@100% | 5,747,438 |
| ssj_ops@100% per JVM | 1,436,859 |
| Target Load | Actual Load | ssj_ops | |
|---|---|---|---|
| Target | Actual | ||
| Calibration 1 | 1,449,634 | ||
| Calibration 2 | 1,445,910 | ||
| Calibration 3 | 1,449,787 | ||
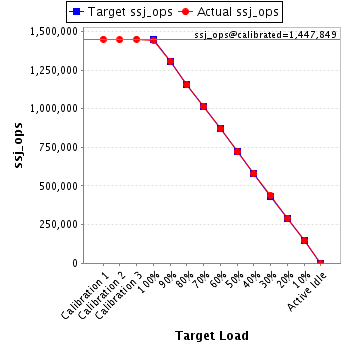
| ssj_ops@calibrated=1,447,849 | |||
| 100% | 99.7% | 1,447,849 | 1,443,253 |
| 90% | 90.3% | 1,303,064 | 1,306,929 |
| 80% | 79.7% | 1,158,279 | 1,153,855 |
| 70% | 70.0% | 1,013,494 | 1,012,860 |
| 60% | 60.0% | 868,709 | 868,869 |
| 50% | 49.8% | 723,924 | 720,991 |
| 40% | 40.0% | 579,139 | 579,131 |
| 30% | 30.2% | 434,355 | 437,309 |
| 20% | 20.1% | 289,570 | 291,179 |
| 10% | 10.1% | 144,785 | 145,595 |
| Active Idle | 0 | 0 | |
| Target Load | Actual Load | ssj_ops | |
|---|---|---|---|
| Target | Actual | ||
| Calibration 1 | 1,428,917 | ||
| Calibration 2 | 1,428,798 | ||
| Calibration 3 | 1,432,452 | ||
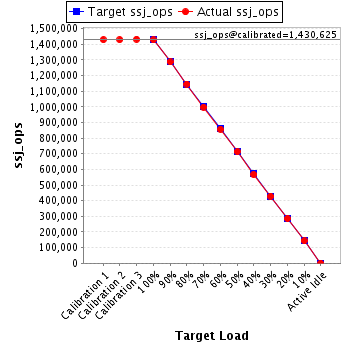
| ssj_ops@calibrated=1,430,625 | |||
| 100% | 99.8% | 1,430,625 | 1,427,268 |
| 90% | 89.9% | 1,287,563 | 1,286,539 |
| 80% | 80.1% | 1,144,500 | 1,145,791 |
| 70% | 69.8% | 1,001,438 | 998,785 |
| 60% | 59.9% | 858,375 | 857,557 |
| 50% | 49.9% | 715,313 | 713,190 |
| 40% | 39.7% | 572,250 | 567,581 |
| 30% | 30.0% | 429,188 | 429,061 |
| 20% | 20.0% | 286,125 | 285,512 |
| 10% | 10.0% | 143,063 | 142,995 |
| Active Idle | 0 | 0 | |
| Target Load | Actual Load | ssj_ops | |
|---|---|---|---|
| Target | Actual | ||
| Calibration 1 | 1,452,720 | ||
| Calibration 2 | 1,447,623 | ||
| Calibration 3 | 1,451,085 | ||
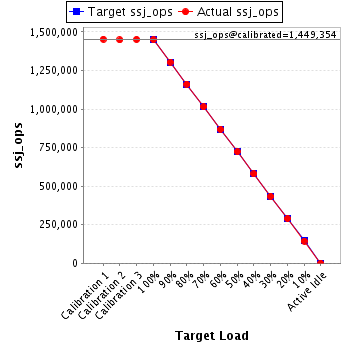
| ssj_ops@calibrated=1,449,354 | |||
| 100% | 100.0% | 1,449,354 | 1,448,993 |
| 90% | 90.0% | 1,304,419 | 1,304,549 |
| 80% | 80.1% | 1,159,483 | 1,161,580 |
| 70% | 70.0% | 1,014,548 | 1,014,141 |
| 60% | 59.9% | 869,612 | 868,534 |
| 50% | 49.9% | 724,677 | 723,165 |
| 40% | 39.9% | 579,742 | 578,959 |
| 30% | 30.0% | 434,806 | 434,473 |
| 20% | 20.0% | 289,871 | 289,755 |
| 10% | 9.9% | 144,935 | 144,016 |
| Active Idle | 0 | 0 | |
| Target Load | Actual Load | ssj_ops | |
|---|---|---|---|
| Target | Actual | ||
| Calibration 1 | 1,439,647 | ||
| Calibration 2 | 1,435,779 | ||
| Calibration 3 | 1,431,686 | ||
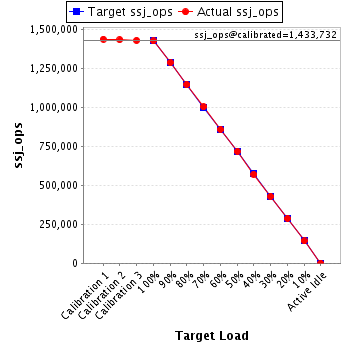
| ssj_ops@calibrated=1,433,732 | |||
| 100% | 99.6% | 1,433,732 | 1,427,923 |
| 90% | 90.0% | 1,290,359 | 1,290,010 |
| 80% | 80.1% | 1,146,986 | 1,148,291 |
| 70% | 70.1% | 1,003,613 | 1,004,716 |
| 60% | 60.0% | 860,239 | 860,340 |
| 50% | 50.1% | 716,866 | 718,838 |
| 40% | 39.9% | 573,493 | 571,915 |
| 30% | 30.0% | 430,120 | 429,433 |
| 20% | 20.0% | 286,746 | 287,417 |
| 10% | 10.0% | 143,373 | 143,286 |
| Active Idle | 0 | 0 | |