SPECpower_ssj2008
Host 'NODE09' Performance Report
Copyright © 2007-2018 Standard Performance Evaluation Corporation
| Hewlett Packard Enterprise Synergy 480 Gen10 Compute Module | ssj_ops@100% = 5,714,631 ssj_ops@100% per JVM = 1,428,658 |
||||
| Test Sponsor: | Hewlett Packard Enterprise | SPEC License #: | 3 | Test Method: | Multi Node |
| Tested By: | Hewlett Packard Enterprise | Test Location: | Houston, TX, USA | Test Date: | Aug 24, 2018 |
| Hardware Availability: | Jun-2018 | Software Availability: | Mar-2018 | Publication: | Sep 12, 2018 |
| System Source: | Single Supplier | System Designation: | Server | Power Provisioning: | Line-powered |
| Target Load | Actual Load | ssj_ops | |
|---|---|---|---|
| Target | Actual | ||
| Calibration 1 | 5,726,115 | ||
| Calibration 2 | 5,722,668 | ||
| Calibration 3 | 5,731,467 | ||
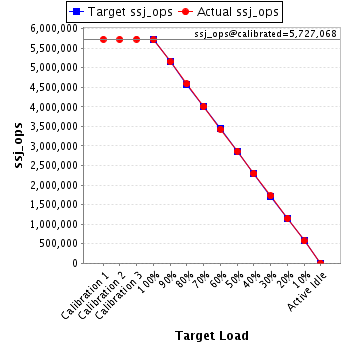
| ssj_ops@calibrated=5,727,068 | |||
| 100% | 99.8% | 5,727,068 | 5,714,631 |
| 90% | 90.0% | 5,154,361 | 5,154,839 |
| 80% | 80.1% | 4,581,654 | 4,587,106 |
| 70% | 70.0% | 4,008,948 | 4,008,649 |
| 60% | 59.9% | 3,436,241 | 3,429,352 |
| 50% | 50.0% | 2,863,534 | 2,864,802 |
| 40% | 40.0% | 2,290,827 | 2,293,549 |
| 30% | 30.0% | 1,718,120 | 1,720,637 |
| 20% | 20.0% | 1,145,414 | 1,147,813 |
| 10% | 10.0% | 572,707 | 570,376 |
| Active Idle | 0 | 0 | |
| Set Identifier: | SUT |
| Set Description: | System Under Test |
| # of Identical Nodes: | 10 |
| Comment: | SUT |
| Hardware | |
|---|---|
| Hardware Vendor: | Hewlett Packard Enterprise |
| Model: | Synergy 480 Gen10 Compute Module |
| Form Factor: | Other |
| CPU Name: | Intel Xeon Platinum 8180 2.50GHz |
| CPU Characteristics: | 28-Core, 2.50 GHz, 38.5 MB L3 Cache |
| CPU Frequency (MHz): | 2500 |
| CPU(s) Enabled: | 56 cores, 2 chips, 28 cores/chip |
| Hardware Threads: | 112 (2 / core) |
| CPU(s) Orderable: | 1,2 chips |
| Primary Cache: | 32 KB I + 32 KB D on chip per core |
| Secondary Cache: | 1 MB I+D on chip per core |
| Tertiary Cache: | 39424 KB I+D on chip per chip |
| Other Cache: | None |
| Memory Amount (GB): | 192 |
| # and size of DIMM: | 12 x 16384 MB |
| Memory Details: | 12 x 16GB 2Rx8 PC4-2666-V ECC; slots 1, 3, 5, 8, 10 and 12 populated on each CPU socket |
| Power Supply Quantity and Rating (W): | None |
| Power Supply Details: | Shared |
| Disk Drive: | 1 x HPE Synergy 480 Gen10 M.2 FIO Adapter Board Kit (873165-B21); 1 x HPE 480GB SATA 6G Read Intensive M.2 2280 SSD (875498-B21) |
| Disk Controller: | 1 x HPE Smart Array S100i SR Gen10 |
| # and type of Network Interface Cards (NICs) Installed: | 1 x HPE Synergy 3820C 10/20Gb 2-port Converged Network Adapter (777430-B21) |
| NICs Enabled in Firmware / OS / Connected: | 2/1/1 |
| Network Speed (Mbit): | 10000 |
| Keyboard: | None |
| Mouse: | None |
| Monitor: | None |
| Optical Drives: | No |
| Other Hardware: | None |
| Software | |
|---|---|
| Power Management: | Enabled (see SUT Notes) |
| Operating System (OS): | Windows Server 2012 R2 Datacenter |
| OS Version: | 6.3 (Build 9600) |
| Filesystem: | NTFS |
| JVM Vendor: | Oracle Corporation |
| JVM Version: | Java HotSpot(TM) 64-Bit Server VM (build 24.80-b11, mixed mode), version 1.7.0_80 |
| JVM Command-line Options: | -server -Xmn19g -Xms21g -Xmx21g -XX:SurvivorRatio=1 -XX:TargetSurvivorRatio=99 -XX:ParallelGCThreads=28 -XX:AllocatePrefetchDistance=256 -XX:AllocatePrefetchLines=4 -XX:LoopUnrollLimit=45 -XX:InitialTenuringThreshold=12 -XX:MaxTenuringThreshold=15 -XX:InlineSmallCode=9000 -XX:MaxInlineSize=270 -XX:FreqInlineSize=6000 -XX:+UseLargePages -XX:+UseParallelOldGC -XX:+AggressiveOpts |
| JVM Affinity: | start /NODE [0,1,2,3] /AFFINITY [0xFFFFFFF] |
| JVM Instances: | 4 |
| JVM Initial Heap (MB): | 21000 |
| JVM Maximum Heap (MB): | 21000 |
| JVM Address Bits: | 64 |
| Boot Firmware Version: | I42 v1.32 (02/01/2018) |
| Management Firmware Version: | 1.15 Aug 17 2017 |
| Workload Version: | SSJ 1.2.10 |
| Director Location: | Controller |
| Other Software: | HPE Composer Version 3.10.07 (HPE OneView) with HPE Synergy Custom SPP Bundle 2017.10.20180323; Microsoft Windows KB4054519, KB4056898 |
| JVM Instance | ssj_ops@100% |
|---|---|
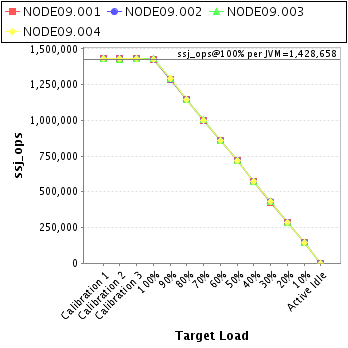
| NODE09.001 | 1,428,620 |
| NODE09.002 | 1,428,282 |
| NODE09.003 | 1,430,112 |
| NODE09.004 | 1,427,618 |
| ssj_ops@100% | 5,714,631 |
| ssj_ops@100% per JVM | 1,428,658 |
| Target Load | Actual Load | ssj_ops | |
|---|---|---|---|
| Target | Actual | ||
| Calibration 1 | 1,434,958 | ||
| Calibration 2 | 1,430,196 | ||
| Calibration 3 | 1,431,951 | ||
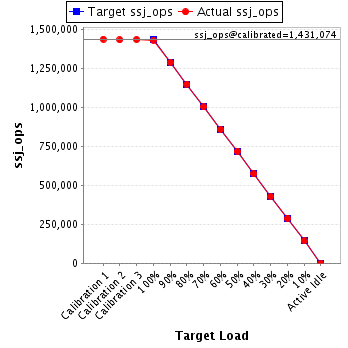
| ssj_ops@calibrated=1,431,074 | |||
| 100% | 99.8% | 1,431,074 | 1,428,620 |
| 90% | 89.9% | 1,287,966 | 1,286,648 |
| 80% | 80.2% | 1,144,859 | 1,147,287 |
| 70% | 70.0% | 1,001,752 | 1,001,042 |
| 60% | 59.9% | 858,644 | 857,899 |
| 50% | 50.0% | 715,537 | 716,222 |
| 40% | 40.0% | 572,429 | 572,457 |
| 30% | 29.9% | 429,322 | 428,214 |
| 20% | 20.0% | 286,215 | 286,812 |
| 10% | 10.0% | 143,107 | 143,321 |
| Active Idle | 0 | 0 | |
| Target Load | Actual Load | ssj_ops | |
|---|---|---|---|
| Target | Actual | ||
| Calibration 1 | 1,430,423 | ||
| Calibration 2 | 1,431,806 | ||
| Calibration 3 | 1,432,180 | ||
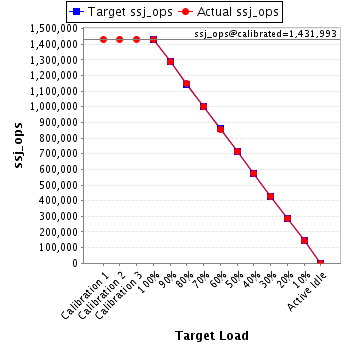
| ssj_ops@calibrated=1,431,993 | |||
| 100% | 99.7% | 1,431,993 | 1,428,282 |
| 90% | 89.8% | 1,288,794 | 1,286,490 |
| 80% | 80.1% | 1,145,594 | 1,147,609 |
| 70% | 70.0% | 1,002,395 | 1,001,874 |
| 60% | 59.8% | 859,196 | 856,691 |
| 50% | 50.0% | 715,997 | 715,546 |
| 40% | 40.0% | 572,797 | 573,294 |
| 30% | 30.0% | 429,598 | 429,490 |
| 20% | 20.0% | 286,399 | 285,732 |
| 10% | 9.9% | 143,199 | 142,427 |
| Active Idle | 0 | 0 | |
| Target Load | Actual Load | ssj_ops | |
|---|---|---|---|
| Target | Actual | ||
| Calibration 1 | 1,429,290 | ||
| Calibration 2 | 1,428,828 | ||
| Calibration 3 | 1,434,039 | ||
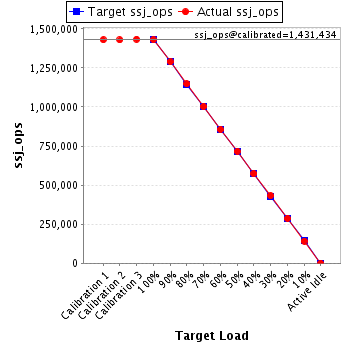
| ssj_ops@calibrated=1,431,434 | |||
| 100% | 99.9% | 1,431,434 | 1,430,112 |
| 90% | 90.1% | 1,288,290 | 1,289,354 |
| 80% | 80.2% | 1,145,147 | 1,147,685 |
| 70% | 70.1% | 1,002,004 | 1,003,805 |
| 60% | 59.9% | 858,860 | 856,902 |
| 50% | 50.1% | 715,717 | 717,090 |
| 40% | 40.0% | 572,573 | 572,568 |
| 30% | 30.2% | 429,430 | 431,848 |
| 20% | 20.1% | 286,287 | 287,502 |
| 10% | 9.9% | 143,143 | 141,933 |
| Active Idle | 0 | 0 | |
| Target Load | Actual Load | ssj_ops | |
|---|---|---|---|
| Target | Actual | ||
| Calibration 1 | 1,431,444 | ||
| Calibration 2 | 1,431,838 | ||
| Calibration 3 | 1,433,297 | ||
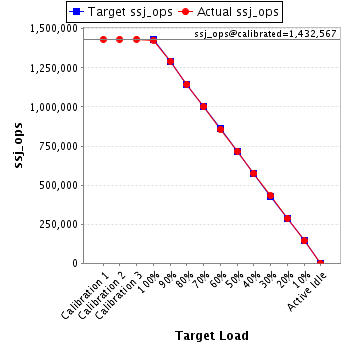
| ssj_ops@calibrated=1,432,567 | |||
| 100% | 99.7% | 1,432,567 | 1,427,618 |
| 90% | 90.2% | 1,289,311 | 1,292,347 |
| 80% | 79.9% | 1,146,054 | 1,144,526 |
| 70% | 69.9% | 1,002,797 | 1,001,928 |
| 60% | 59.9% | 859,540 | 857,859 |
| 50% | 50.0% | 716,284 | 715,943 |
| 40% | 40.2% | 573,027 | 575,230 |
| 30% | 30.1% | 429,770 | 431,085 |
| 20% | 20.1% | 286,513 | 287,768 |
| 10% | 10.0% | 143,257 | 142,695 |
| Active Idle | 0 | 0 | |