SPECpower_ssj2008
Host 'NODE07' Performance Report
Copyright © 2007-2018 Standard Performance Evaluation Corporation
| Hewlett Packard Enterprise Synergy 480 Gen10 Compute Module | ssj_ops@100% = 5,718,495 ssj_ops@100% per JVM = 1,429,624 |
||||
| Test Sponsor: | Hewlett Packard Enterprise | SPEC License #: | 3 | Test Method: | Multi Node |
| Tested By: | Hewlett Packard Enterprise | Test Location: | Houston, TX, USA | Test Date: | Aug 24, 2018 |
| Hardware Availability: | Jun-2018 | Software Availability: | Mar-2018 | Publication: | Sep 12, 2018 |
| System Source: | Single Supplier | System Designation: | Server | Power Provisioning: | Line-powered |
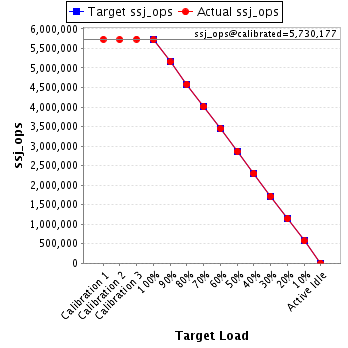
| Target Load | Actual Load | ssj_ops | |
|---|---|---|---|
| Target | Actual | ||
| Calibration 1 | 5,730,655 | ||
| Calibration 2 | 5,723,881 | ||
| Calibration 3 | 5,736,472 | ||
| ssj_ops@calibrated=5,730,177 | |||
| 100% | 99.8% | 5,730,177 | 5,718,495 |
| 90% | 90.0% | 5,157,159 | 5,155,751 |
| 80% | 79.9% | 4,584,141 | 4,580,698 |
| 70% | 70.0% | 4,011,124 | 4,009,537 |
| 60% | 60.1% | 3,438,106 | 3,441,740 |
| 50% | 50.0% | 2,865,088 | 2,862,810 |
| 40% | 40.0% | 2,292,071 | 2,293,120 |
| 30% | 30.0% | 1,719,053 | 1,717,367 |
| 20% | 19.9% | 1,146,035 | 1,140,857 |
| 10% | 10.0% | 573,018 | 573,252 |
| Active Idle | 0 | 0 | |
| Set Identifier: | SUT |
| Set Description: | System Under Test |
| # of Identical Nodes: | 10 |
| Comment: | SUT |
| Hardware | |
|---|---|
| Hardware Vendor: | Hewlett Packard Enterprise |
| Model: | Synergy 480 Gen10 Compute Module |
| Form Factor: | Other |
| CPU Name: | Intel Xeon Platinum 8180 2.50GHz |
| CPU Characteristics: | 28-Core, 2.50 GHz, 38.5 MB L3 Cache |
| CPU Frequency (MHz): | 2500 |
| CPU(s) Enabled: | 56 cores, 2 chips, 28 cores/chip |
| Hardware Threads: | 112 (2 / core) |
| CPU(s) Orderable: | 1,2 chips |
| Primary Cache: | 32 KB I + 32 KB D on chip per core |
| Secondary Cache: | 1 MB I+D on chip per core |
| Tertiary Cache: | 39424 KB I+D on chip per chip |
| Other Cache: | None |
| Memory Amount (GB): | 192 |
| # and size of DIMM: | 12 x 16384 MB |
| Memory Details: | 12 x 16GB 2Rx8 PC4-2666-V ECC; slots 1, 3, 5, 8, 10 and 12 populated on each CPU socket |
| Power Supply Quantity and Rating (W): | None |
| Power Supply Details: | Shared |
| Disk Drive: | 1 x HPE Synergy 480 Gen10 M.2 FIO Adapter Board Kit (873165-B21); 1 x HPE 480GB SATA 6G Read Intensive M.2 2280 SSD (875498-B21) |
| Disk Controller: | 1 x HPE Smart Array S100i SR Gen10 |
| # and type of Network Interface Cards (NICs) Installed: | 1 x HPE Synergy 3820C 10/20Gb 2-port Converged Network Adapter (777430-B21) |
| NICs Enabled in Firmware / OS / Connected: | 2/1/1 |
| Network Speed (Mbit): | 10000 |
| Keyboard: | None |
| Mouse: | None |
| Monitor: | None |
| Optical Drives: | No |
| Other Hardware: | None |
| Software | |
|---|---|
| Power Management: | Enabled (see SUT Notes) |
| Operating System (OS): | Windows Server 2012 R2 Datacenter |
| OS Version: | 6.3 (Build 9600) |
| Filesystem: | NTFS |
| JVM Vendor: | Oracle Corporation |
| JVM Version: | Java HotSpot(TM) 64-Bit Server VM (build 24.80-b11, mixed mode), version 1.7.0_80 |
| JVM Command-line Options: | -server -Xmn19g -Xms21g -Xmx21g -XX:SurvivorRatio=1 -XX:TargetSurvivorRatio=99 -XX:ParallelGCThreads=28 -XX:AllocatePrefetchDistance=256 -XX:AllocatePrefetchLines=4 -XX:LoopUnrollLimit=45 -XX:InitialTenuringThreshold=12 -XX:MaxTenuringThreshold=15 -XX:InlineSmallCode=9000 -XX:MaxInlineSize=270 -XX:FreqInlineSize=6000 -XX:+UseLargePages -XX:+UseParallelOldGC -XX:+AggressiveOpts |
| JVM Affinity: | start /NODE [0,1,2,3] /AFFINITY [0xFFFFFFF] |
| JVM Instances: | 4 |
| JVM Initial Heap (MB): | 21000 |
| JVM Maximum Heap (MB): | 21000 |
| JVM Address Bits: | 64 |
| Boot Firmware Version: | I42 v1.32 (02/01/2018) |
| Management Firmware Version: | 1.15 Aug 17 2017 |
| Workload Version: | SSJ 1.2.10 |
| Director Location: | Controller |
| Other Software: | HPE Composer Version 3.10.07 (HPE OneView) with HPE Synergy Custom SPP Bundle 2017.10.20180323; Microsoft Windows KB4054519, KB4056898 |
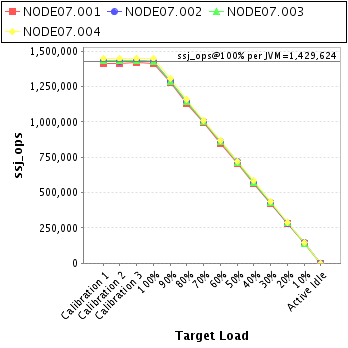
| JVM Instance | ssj_ops@100% |
|---|---|
| NODE07.001 | 1,416,152 |
| NODE07.002 | 1,430,457 |
| NODE07.003 | 1,426,178 |
| NODE07.004 | 1,445,708 |
| ssj_ops@100% | 5,718,495 |
| ssj_ops@100% per JVM | 1,429,624 |
| Target Load | Actual Load | ssj_ops | |
|---|---|---|---|
| Target | Actual | ||
| Calibration 1 | 1,414,814 | ||
| Calibration 2 | 1,415,219 | ||
| Calibration 3 | 1,419,299 | ||
| ssj_ops@calibrated=1,417,259 | |||
| 100% | 99.9% | 1,417,259 | 1,416,152 |
| 90% | 90.1% | 1,275,533 | 1,277,526 |
| 80% | 79.8% | 1,133,807 | 1,131,113 |
| 70% | 70.0% | 992,081 | 992,304 |
| 60% | 59.9% | 850,355 | 849,564 |
| 50% | 50.0% | 708,629 | 709,116 |
| 40% | 39.8% | 566,904 | 563,463 |
| 30% | 29.9% | 425,178 | 424,087 |
| 20% | 19.9% | 283,452 | 281,946 |
| 10% | 10.0% | 141,726 | 141,749 |
| Active Idle | 0 | 0 | |
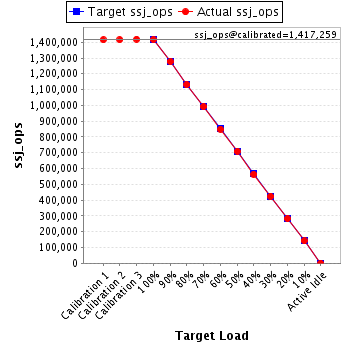
| Target Load | Actual Load | ssj_ops | |
|---|---|---|---|
| Target | Actual | ||
| Calibration 1 | 1,433,725 | ||
| Calibration 2 | 1,429,582 | ||
| Calibration 3 | 1,433,149 | ||
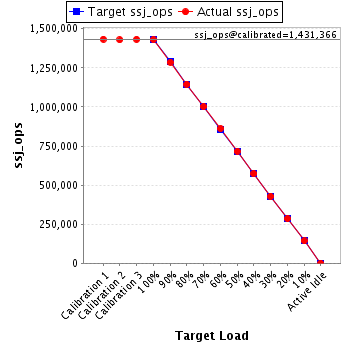
| ssj_ops@calibrated=1,431,366 | |||
| 100% | 99.9% | 1,431,366 | 1,430,457 |
| 90% | 89.8% | 1,288,229 | 1,285,676 |
| 80% | 80.0% | 1,145,092 | 1,145,076 |
| 70% | 70.1% | 1,001,956 | 1,002,891 |
| 60% | 60.2% | 858,819 | 861,800 |
| 50% | 50.1% | 715,683 | 716,838 |
| 40% | 40.0% | 572,546 | 572,414 |
| 30% | 30.0% | 429,410 | 428,941 |
| 20% | 19.9% | 286,273 | 284,569 |
| 10% | 10.0% | 143,137 | 143,393 |
| Active Idle | 0 | 0 | |
| Target Load | Actual Load | ssj_ops | |
|---|---|---|---|
| Target | Actual | ||
| Calibration 1 | 1,433,125 | ||
| Calibration 2 | 1,431,376 | ||
| Calibration 3 | 1,433,215 | ||
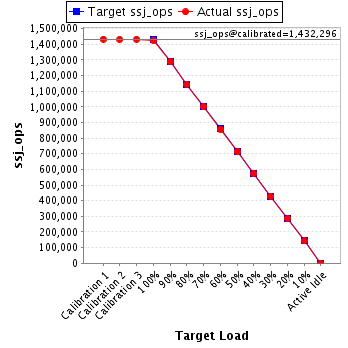
| ssj_ops@calibrated=1,432,296 | |||
| 100% | 99.6% | 1,432,296 | 1,426,178 |
| 90% | 89.9% | 1,289,066 | 1,287,295 |
| 80% | 79.9% | 1,145,837 | 1,144,364 |
| 70% | 69.9% | 1,002,607 | 1,000,974 |
| 60% | 59.9% | 859,377 | 858,453 |
| 50% | 49.8% | 716,148 | 713,663 |
| 40% | 40.1% | 572,918 | 574,535 |
| 30% | 30.0% | 429,689 | 429,417 |
| 20% | 19.9% | 286,459 | 285,212 |
| 10% | 10.0% | 143,230 | 142,848 |
| Active Idle | 0 | 0 | |
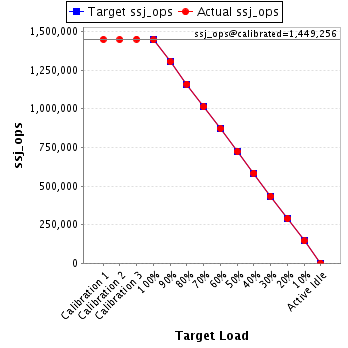
| Target Load | Actual Load | ssj_ops | |
|---|---|---|---|
| Target | Actual | ||
| Calibration 1 | 1,448,991 | ||
| Calibration 2 | 1,447,704 | ||
| Calibration 3 | 1,450,809 | ||
| ssj_ops@calibrated=1,449,256 | |||
| 100% | 99.8% | 1,449,256 | 1,445,708 |
| 90% | 90.1% | 1,304,331 | 1,305,253 |
| 80% | 80.1% | 1,159,405 | 1,160,145 |
| 70% | 69.9% | 1,014,479 | 1,013,368 |
| 60% | 60.2% | 869,554 | 871,923 |
| 50% | 49.9% | 724,628 | 723,193 |
| 40% | 40.2% | 579,703 | 582,708 |
| 30% | 30.0% | 434,777 | 434,922 |
| 20% | 20.0% | 289,851 | 289,130 |
| 10% | 10.0% | 144,926 | 145,261 |
| Active Idle | 0 | 0 | |