
SPECpower_ssj2008
Host 'NODE05' Performance Report
Copyright © 2007-2018 Standard Performance Evaluation Corporation
| Hewlett Packard Enterprise Synergy 480 Gen10 Compute Module | ssj_ops@100% = 5,731,394 ssj_ops@100% per JVM = 1,432,848 |
||||
| Test Sponsor: | Hewlett Packard Enterprise | SPEC License #: | 3 | Test Method: | Multi Node |
| Tested By: | Hewlett Packard Enterprise | Test Location: | Houston, TX, USA | Test Date: | Aug 24, 2018 |
| Hardware Availability: | Jun-2018 | Software Availability: | Mar-2018 | Publication: | Sep 12, 2018 |
| System Source: | Single Supplier | System Designation: | Server | Power Provisioning: | Line-powered |
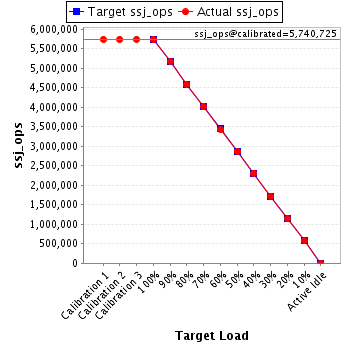
| Target Load | Actual Load | ssj_ops | |
|---|---|---|---|
| Target | Actual | ||
| Calibration 1 | 5,737,863 | ||
| Calibration 2 | 5,738,401 | ||
| Calibration 3 | 5,743,048 | ||
| ssj_ops@calibrated=5,740,725 | |||
| 100% | 99.8% | 5,740,725 | 5,731,394 |
| 90% | 90.1% | 5,166,652 | 5,171,231 |
| 80% | 80.0% | 4,592,580 | 4,591,275 |
| 70% | 70.1% | 4,018,507 | 4,021,528 |
| 60% | 59.8% | 3,444,435 | 3,434,061 |
| 50% | 50.0% | 2,870,362 | 2,869,560 |
| 40% | 40.1% | 2,296,290 | 2,302,033 |
| 30% | 30.0% | 1,722,217 | 1,722,595 |
| 20% | 19.9% | 1,148,145 | 1,145,267 |
| 10% | 10.0% | 574,072 | 573,653 |
| Active Idle | 0 | 0 | |
| Set Identifier: | SUT |
| Set Description: | System Under Test |
| # of Identical Nodes: | 10 |
| Comment: | SUT |
| Hardware | |
|---|---|
| Hardware Vendor: | Hewlett Packard Enterprise |
| Model: | Synergy 480 Gen10 Compute Module |
| Form Factor: | Other |
| CPU Name: | Intel Xeon Platinum 8180 2.50GHz |
| CPU Characteristics: | 28-Core, 2.50 GHz, 38.5 MB L3 Cache |
| CPU Frequency (MHz): | 2500 |
| CPU(s) Enabled: | 56 cores, 2 chips, 28 cores/chip |
| Hardware Threads: | 112 (2 / core) |
| CPU(s) Orderable: | 1,2 chips |
| Primary Cache: | 32 KB I + 32 KB D on chip per core |
| Secondary Cache: | 1 MB I+D on chip per core |
| Tertiary Cache: | 39424 KB I+D on chip per chip |
| Other Cache: | None |
| Memory Amount (GB): | 192 |
| # and size of DIMM: | 12 x 16384 MB |
| Memory Details: | 12 x 16GB 2Rx8 PC4-2666-V ECC; slots 1, 3, 5, 8, 10 and 12 populated on each CPU socket |
| Power Supply Quantity and Rating (W): | None |
| Power Supply Details: | Shared |
| Disk Drive: | 1 x HPE Synergy 480 Gen10 M.2 FIO Adapter Board Kit (873165-B21); 1 x HPE 480GB SATA 6G Read Intensive M.2 2280 SSD (875498-B21) |
| Disk Controller: | 1 x HPE Smart Array S100i SR Gen10 |
| # and type of Network Interface Cards (NICs) Installed: | 1 x HPE Synergy 3820C 10/20Gb 2-port Converged Network Adapter (777430-B21) |
| NICs Enabled in Firmware / OS / Connected: | 2/1/1 |
| Network Speed (Mbit): | 10000 |
| Keyboard: | None |
| Mouse: | None |
| Monitor: | None |
| Optical Drives: | No |
| Other Hardware: | None |
| Software | |
|---|---|
| Power Management: | Enabled (see SUT Notes) |
| Operating System (OS): | Windows Server 2012 R2 Datacenter |
| OS Version: | 6.3 (Build 9600) |
| Filesystem: | NTFS |
| JVM Vendor: | Oracle Corporation |
| JVM Version: | Java HotSpot(TM) 64-Bit Server VM (build 24.80-b11, mixed mode), version 1.7.0_80 |
| JVM Command-line Options: | -server -Xmn19g -Xms21g -Xmx21g -XX:SurvivorRatio=1 -XX:TargetSurvivorRatio=99 -XX:ParallelGCThreads=28 -XX:AllocatePrefetchDistance=256 -XX:AllocatePrefetchLines=4 -XX:LoopUnrollLimit=45 -XX:InitialTenuringThreshold=12 -XX:MaxTenuringThreshold=15 -XX:InlineSmallCode=9000 -XX:MaxInlineSize=270 -XX:FreqInlineSize=6000 -XX:+UseLargePages -XX:+UseParallelOldGC -XX:+AggressiveOpts |
| JVM Affinity: | start /NODE [0,1,2,3] /AFFINITY [0xFFFFFFF] |
| JVM Instances: | 4 |
| JVM Initial Heap (MB): | 21000 |
| JVM Maximum Heap (MB): | 21000 |
| JVM Address Bits: | 64 |
| Boot Firmware Version: | I42 v1.32 (02/01/2018) |
| Management Firmware Version: | 1.15 Aug 17 2017 |
| Workload Version: | SSJ 1.2.10 |
| Director Location: | Controller |
| Other Software: | HPE Composer Version 3.10.07 (HPE OneView) with HPE Synergy Custom SPP Bundle 2017.10.20180323; Microsoft Windows KB4054519, KB4056898 |
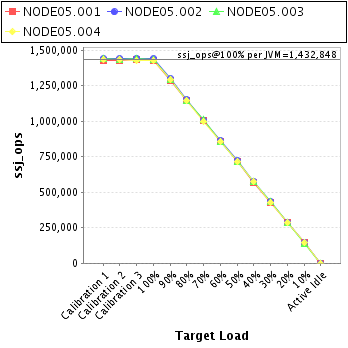
| JVM Instance | ssj_ops@100% |
|---|---|
| NODE05.001 | 1,428,559 |
| NODE05.002 | 1,439,134 |
| NODE05.003 | 1,434,913 |
| NODE05.004 | 1,428,788 |
| ssj_ops@100% | 5,731,394 |
| ssj_ops@100% per JVM | 1,432,848 |
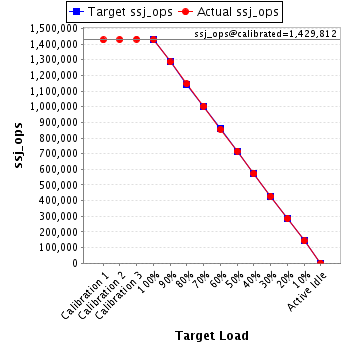
| Target Load | Actual Load | ssj_ops | |
|---|---|---|---|
| Target | Actual | ||
| Calibration 1 | 1,426,089 | ||
| Calibration 2 | 1,428,303 | ||
| Calibration 3 | 1,431,322 | ||
| ssj_ops@calibrated=1,429,812 | |||
| 100% | 99.9% | 1,429,812 | 1,428,559 |
| 90% | 89.9% | 1,286,831 | 1,285,521 |
| 80% | 80.1% | 1,143,850 | 1,145,871 |
| 70% | 70.2% | 1,000,869 | 1,003,856 |
| 60% | 59.8% | 857,887 | 855,576 |
| 50% | 50.1% | 714,906 | 715,839 |
| 40% | 40.0% | 571,925 | 571,558 |
| 30% | 29.9% | 428,944 | 427,850 |
| 20% | 20.0% | 285,962 | 285,275 |
| 10% | 10.0% | 142,981 | 143,086 |
| Active Idle | 0 | 0 | |
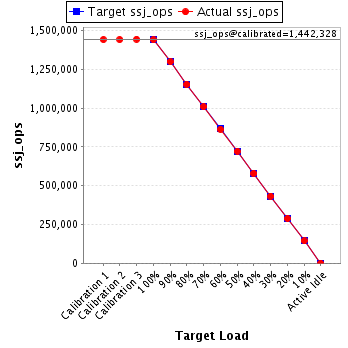
| Target Load | Actual Load | ssj_ops | |
|---|---|---|---|
| Target | Actual | ||
| Calibration 1 | 1,440,878 | ||
| Calibration 2 | 1,440,959 | ||
| Calibration 3 | 1,443,697 | ||
| ssj_ops@calibrated=1,442,328 | |||
| 100% | 99.8% | 1,442,328 | 1,439,134 |
| 90% | 90.0% | 1,298,095 | 1,298,411 |
| 80% | 79.9% | 1,153,862 | 1,152,149 |
| 70% | 69.9% | 1,009,630 | 1,008,379 |
| 60% | 59.8% | 865,397 | 863,208 |
| 50% | 50.0% | 721,164 | 721,624 |
| 40% | 40.1% | 576,931 | 578,454 |
| 30% | 30.0% | 432,698 | 433,205 |
| 20% | 19.9% | 288,466 | 287,660 |
| 10% | 10.0% | 144,233 | 143,877 |
| Active Idle | 0 | 0 | |
| Target Load | Actual Load | ssj_ops | |
|---|---|---|---|
| Target | Actual | ||
| Calibration 1 | 1,438,337 | ||
| Calibration 2 | 1,437,561 | ||
| Calibration 3 | 1,438,725 | ||
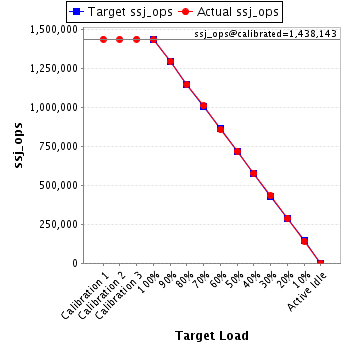
| ssj_ops@calibrated=1,438,143 | |||
| 100% | 99.8% | 1,438,143 | 1,434,913 |
| 90% | 90.1% | 1,294,329 | 1,296,275 |
| 80% | 79.8% | 1,150,514 | 1,147,722 |
| 70% | 70.3% | 1,006,700 | 1,010,423 |
| 60% | 59.7% | 862,886 | 858,843 |
| 50% | 50.0% | 719,072 | 718,735 |
| 40% | 40.2% | 575,257 | 577,650 |
| 30% | 30.1% | 431,443 | 432,617 |
| 20% | 20.0% | 287,629 | 287,826 |
| 10% | 9.9% | 143,814 | 142,555 |
| Active Idle | 0 | 0 | |
| Target Load | Actual Load | ssj_ops | |
|---|---|---|---|
| Target | Actual | ||
| Calibration 1 | 1,432,559 | ||
| Calibration 2 | 1,431,578 | ||
| Calibration 3 | 1,429,304 | ||
| ssj_ops@calibrated=1,430,441 | |||
| 100% | 99.9% | 1,430,441 | 1,428,788 |
| 90% | 90.3% | 1,287,397 | 1,291,024 |
| 80% | 80.1% | 1,144,353 | 1,145,533 |
| 70% | 69.8% | 1,001,309 | 998,871 |
| 60% | 59.9% | 858,265 | 856,434 |
| 50% | 49.9% | 715,221 | 713,362 |
| 40% | 40.2% | 572,176 | 574,371 |
| 30% | 30.0% | 429,132 | 428,922 |
| 20% | 19.9% | 286,088 | 284,505 |
| 10% | 10.1% | 143,044 | 144,135 |
| Active Idle | 0 | 0 | |
