SPECpower_ssj2008
Host 'NODE04' Performance Report
Copyright © 2007-2018 Standard Performance Evaluation Corporation
| Hewlett Packard Enterprise Synergy 480 Gen10 Compute Module | ssj_ops@100% = 5,745,064 ssj_ops@100% per JVM = 1,436,266 |
||||
| Test Sponsor: | Hewlett Packard Enterprise | SPEC License #: | 3 | Test Method: | Multi Node |
| Tested By: | Hewlett Packard Enterprise | Test Location: | Houston, TX, USA | Test Date: | Aug 24, 2018 |
| Hardware Availability: | Jun-2018 | Software Availability: | Mar-2018 | Publication: | Sep 12, 2018 |
| System Source: | Single Supplier | System Designation: | Server | Power Provisioning: | Line-powered |
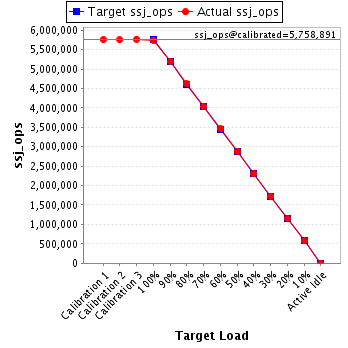
| Target Load | Actual Load | ssj_ops | |
|---|---|---|---|
| Target | Actual | ||
| Calibration 1 | 5,753,320 | ||
| Calibration 2 | 5,749,535 | ||
| Calibration 3 | 5,768,248 | ||
| ssj_ops@calibrated=5,758,891 | |||
| 100% | 99.8% | 5,758,891 | 5,745,064 |
| 90% | 90.1% | 5,183,002 | 5,190,677 |
| 80% | 80.2% | 4,607,113 | 4,618,012 |
| 70% | 70.1% | 4,031,224 | 4,034,810 |
| 60% | 60.1% | 3,455,335 | 3,463,299 |
| 50% | 50.1% | 2,879,446 | 2,887,573 |
| 40% | 39.9% | 2,303,556 | 2,298,462 |
| 30% | 30.0% | 1,727,667 | 1,726,810 |
| 20% | 20.0% | 1,151,778 | 1,148,997 |
| 10% | 10.0% | 575,889 | 577,218 |
| Active Idle | 0 | 0 | |
| Set Identifier: | SUT |
| Set Description: | System Under Test |
| # of Identical Nodes: | 10 |
| Comment: | SUT |
| Hardware | |
|---|---|
| Hardware Vendor: | Hewlett Packard Enterprise |
| Model: | Synergy 480 Gen10 Compute Module |
| Form Factor: | Other |
| CPU Name: | Intel Xeon Platinum 8180 2.50GHz |
| CPU Characteristics: | 28-Core, 2.50 GHz, 38.5 MB L3 Cache |
| CPU Frequency (MHz): | 2500 |
| CPU(s) Enabled: | 56 cores, 2 chips, 28 cores/chip |
| Hardware Threads: | 112 (2 / core) |
| CPU(s) Orderable: | 1,2 chips |
| Primary Cache: | 32 KB I + 32 KB D on chip per core |
| Secondary Cache: | 1 MB I+D on chip per core |
| Tertiary Cache: | 39424 KB I+D on chip per chip |
| Other Cache: | None |
| Memory Amount (GB): | 192 |
| # and size of DIMM: | 12 x 16384 MB |
| Memory Details: | 12 x 16GB 2Rx8 PC4-2666-V ECC; slots 1, 3, 5, 8, 10 and 12 populated on each CPU socket |
| Power Supply Quantity and Rating (W): | None |
| Power Supply Details: | Shared |
| Disk Drive: | 1 x HPE Synergy 480 Gen10 M.2 FIO Adapter Board Kit (873165-B21); 1 x HPE 480GB SATA 6G Read Intensive M.2 2280 SSD (875498-B21) |
| Disk Controller: | 1 x HPE Smart Array S100i SR Gen10 |
| # and type of Network Interface Cards (NICs) Installed: | 1 x HPE Synergy 3820C 10/20Gb 2-port Converged Network Adapter (777430-B21) |
| NICs Enabled in Firmware / OS / Connected: | 2/1/1 |
| Network Speed (Mbit): | 10000 |
| Keyboard: | None |
| Mouse: | None |
| Monitor: | None |
| Optical Drives: | No |
| Other Hardware: | None |
| Software | |
|---|---|
| Power Management: | Enabled (see SUT Notes) |
| Operating System (OS): | Windows Server 2012 R2 Datacenter |
| OS Version: | 6.3 (Build 9600) |
| Filesystem: | NTFS |
| JVM Vendor: | Oracle Corporation |
| JVM Version: | Java HotSpot(TM) 64-Bit Server VM (build 24.80-b11, mixed mode), version 1.7.0_80 |
| JVM Command-line Options: | -server -Xmn19g -Xms21g -Xmx21g -XX:SurvivorRatio=1 -XX:TargetSurvivorRatio=99 -XX:ParallelGCThreads=28 -XX:AllocatePrefetchDistance=256 -XX:AllocatePrefetchLines=4 -XX:LoopUnrollLimit=45 -XX:InitialTenuringThreshold=12 -XX:MaxTenuringThreshold=15 -XX:InlineSmallCode=9000 -XX:MaxInlineSize=270 -XX:FreqInlineSize=6000 -XX:+UseLargePages -XX:+UseParallelOldGC -XX:+AggressiveOpts |
| JVM Affinity: | start /NODE [0,1,2,3] /AFFINITY [0xFFFFFFF] |
| JVM Instances: | 4 |
| JVM Initial Heap (MB): | 21000 |
| JVM Maximum Heap (MB): | 21000 |
| JVM Address Bits: | 64 |
| Boot Firmware Version: | I42 v1.32 (02/01/2018) |
| Management Firmware Version: | 1.15 Aug 17 2017 |
| Workload Version: | SSJ 1.2.10 |
| Director Location: | Controller |
| Other Software: | HPE Composer Version 3.10.07 (HPE OneView) with HPE Synergy Custom SPP Bundle 2017.10.20180323; Microsoft Windows KB4054519, KB4056898 |
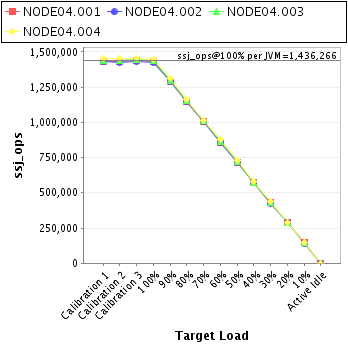
| JVM Instance | ssj_ops@100% |
|---|---|
| NODE04.001 | 1,429,662 |
| NODE04.002 | 1,425,941 |
| NODE04.003 | 1,441,795 |
| NODE04.004 | 1,447,667 |
| ssj_ops@100% | 5,745,064 |
| ssj_ops@100% per JVM | 1,436,266 |
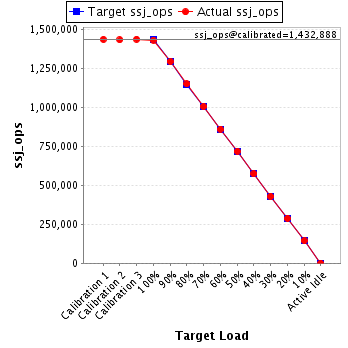
| Target Load | Actual Load | ssj_ops | |
|---|---|---|---|
| Target | Actual | ||
| Calibration 1 | 1,433,919 | ||
| Calibration 2 | 1,430,534 | ||
| Calibration 3 | 1,435,242 | ||
| ssj_ops@calibrated=1,432,888 | |||
| 100% | 99.8% | 1,432,888 | 1,429,662 |
| 90% | 90.2% | 1,289,599 | 1,292,450 |
| 80% | 80.2% | 1,146,311 | 1,148,671 |
| 70% | 70.1% | 1,003,022 | 1,004,542 |
| 60% | 60.0% | 859,733 | 859,590 |
| 50% | 50.1% | 716,444 | 717,662 |
| 40% | 40.0% | 573,155 | 572,457 |
| 30% | 29.9% | 429,866 | 428,257 |
| 20% | 20.1% | 286,578 | 287,570 |
| 10% | 10.1% | 143,289 | 144,078 |
| Active Idle | 0 | 0 | |
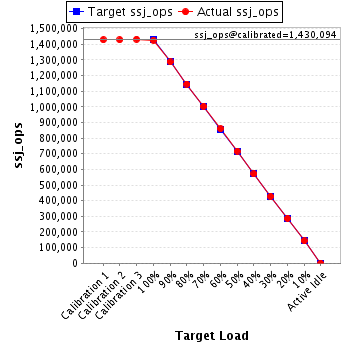
| Target Load | Actual Load | ssj_ops | |
|---|---|---|---|
| Target | Actual | ||
| Calibration 1 | 1,428,121 | ||
| Calibration 2 | 1,427,750 | ||
| Calibration 3 | 1,432,438 | ||
| ssj_ops@calibrated=1,430,094 | |||
| 100% | 99.7% | 1,430,094 | 1,425,941 |
| 90% | 90.0% | 1,287,084 | 1,286,613 |
| 80% | 80.1% | 1,144,075 | 1,145,818 |
| 70% | 70.2% | 1,001,066 | 1,004,059 |
| 60% | 60.1% | 858,056 | 859,990 |
| 50% | 50.2% | 715,047 | 717,541 |
| 40% | 39.9% | 572,037 | 570,626 |
| 30% | 29.9% | 429,028 | 427,432 |
| 20% | 20.1% | 286,019 | 286,939 |
| 10% | 10.0% | 143,009 | 143,102 |
| Active Idle | 0 | 0 | |
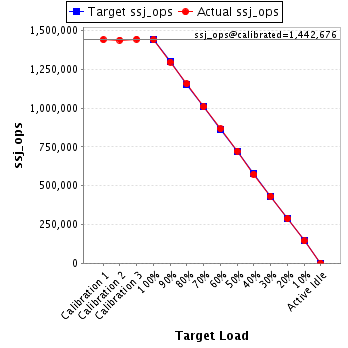
| Target Load | Actual Load | ssj_ops | |
|---|---|---|---|
| Target | Actual | ||
| Calibration 1 | 1,441,541 | ||
| Calibration 2 | 1,439,950 | ||
| Calibration 3 | 1,445,401 | ||
| ssj_ops@calibrated=1,442,676 | |||
| 100% | 99.9% | 1,442,676 | 1,441,795 |
| 90% | 90.0% | 1,298,408 | 1,298,090 |
| 80% | 80.3% | 1,154,141 | 1,158,119 |
| 70% | 70.0% | 1,009,873 | 1,009,711 |
| 60% | 60.1% | 865,605 | 867,102 |
| 50% | 50.1% | 721,338 | 723,480 |
| 40% | 39.8% | 577,070 | 574,366 |
| 30% | 30.0% | 432,803 | 432,728 |
| 20% | 19.9% | 288,535 | 287,407 |
| 10% | 10.0% | 144,268 | 144,266 |
| Active Idle | 0 | 0 | |
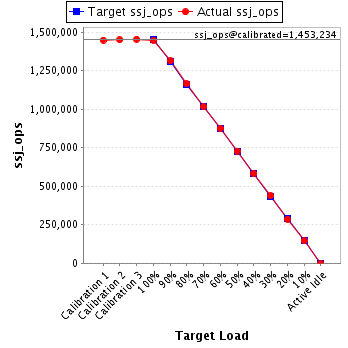
| Target Load | Actual Load | ssj_ops | |
|---|---|---|---|
| Target | Actual | ||
| Calibration 1 | 1,449,738 | ||
| Calibration 2 | 1,451,300 | ||
| Calibration 3 | 1,455,167 | ||
| ssj_ops@calibrated=1,453,234 | |||
| 100% | 99.6% | 1,453,234 | 1,447,667 |
| 90% | 90.4% | 1,307,910 | 1,313,524 |
| 80% | 80.2% | 1,162,587 | 1,165,404 |
| 70% | 69.9% | 1,017,264 | 1,016,498 |
| 60% | 60.3% | 871,940 | 876,617 |
| 50% | 50.2% | 726,617 | 728,889 |
| 40% | 40.0% | 581,293 | 581,014 |
| 30% | 30.2% | 435,970 | 438,393 |
| 20% | 19.8% | 290,647 | 287,081 |
| 10% | 10.0% | 145,323 | 145,773 |
| Active Idle | 0 | 0 | |