SPECpower_ssj2008
Host 'NODE03' Performance Report
Copyright © 2007-2018 Standard Performance Evaluation Corporation
| Hewlett Packard Enterprise Synergy 480 Gen10 Compute Module | ssj_ops@100% = 5,734,170 ssj_ops@100% per JVM = 1,433,542 |
||||
| Test Sponsor: | Hewlett Packard Enterprise | SPEC License #: | 3 | Test Method: | Multi Node |
| Tested By: | Hewlett Packard Enterprise | Test Location: | Houston, TX, USA | Test Date: | Aug 24, 2018 |
| Hardware Availability: | Jun-2018 | Software Availability: | Mar-2018 | Publication: | Sep 12, 2018 |
| System Source: | Single Supplier | System Designation: | Server | Power Provisioning: | Line-powered |
| Target Load | Actual Load | ssj_ops | |
|---|---|---|---|
| Target | Actual | ||
| Calibration 1 | 5,754,123 | ||
| Calibration 2 | 5,745,141 | ||
| Calibration 3 | 5,754,144 | ||
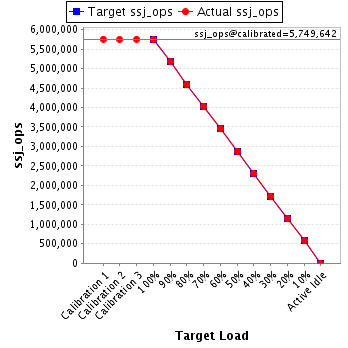
| ssj_ops@calibrated=5,749,642 | |||
| 100% | 99.7% | 5,749,642 | 5,734,170 |
| 90% | 90.0% | 5,174,678 | 5,175,267 |
| 80% | 79.9% | 4,599,714 | 4,595,739 |
| 70% | 69.9% | 4,024,750 | 4,021,607 |
| 60% | 60.0% | 3,449,785 | 3,451,028 |
| 50% | 50.0% | 2,874,821 | 2,872,800 |
| 40% | 40.1% | 2,299,857 | 2,307,468 |
| 30% | 30.0% | 1,724,893 | 1,726,405 |
| 20% | 19.9% | 1,149,928 | 1,146,836 |
| 10% | 10.1% | 574,964 | 578,320 |
| Active Idle | 0 | 0 | |
| Set Identifier: | SUT |
| Set Description: | System Under Test |
| # of Identical Nodes: | 10 |
| Comment: | SUT |
| Hardware | |
|---|---|
| Hardware Vendor: | Hewlett Packard Enterprise |
| Model: | Synergy 480 Gen10 Compute Module |
| Form Factor: | Other |
| CPU Name: | Intel Xeon Platinum 8180 2.50GHz |
| CPU Characteristics: | 28-Core, 2.50 GHz, 38.5 MB L3 Cache |
| CPU Frequency (MHz): | 2500 |
| CPU(s) Enabled: | 56 cores, 2 chips, 28 cores/chip |
| Hardware Threads: | 112 (2 / core) |
| CPU(s) Orderable: | 1,2 chips |
| Primary Cache: | 32 KB I + 32 KB D on chip per core |
| Secondary Cache: | 1 MB I+D on chip per core |
| Tertiary Cache: | 39424 KB I+D on chip per chip |
| Other Cache: | None |
| Memory Amount (GB): | 192 |
| # and size of DIMM: | 12 x 16384 MB |
| Memory Details: | 12 x 16GB 2Rx8 PC4-2666-V ECC; slots 1, 3, 5, 8, 10 and 12 populated on each CPU socket |
| Power Supply Quantity and Rating (W): | None |
| Power Supply Details: | Shared |
| Disk Drive: | 1 x HPE Synergy 480 Gen10 M.2 FIO Adapter Board Kit (873165-B21); 1 x HPE 480GB SATA 6G Read Intensive M.2 2280 SSD (875498-B21) |
| Disk Controller: | 1 x HPE Smart Array S100i SR Gen10 |
| # and type of Network Interface Cards (NICs) Installed: | 1 x HPE Synergy 3820C 10/20Gb 2-port Converged Network Adapter (777430-B21) |
| NICs Enabled in Firmware / OS / Connected: | 2/1/1 |
| Network Speed (Mbit): | 10000 |
| Keyboard: | None |
| Mouse: | None |
| Monitor: | None |
| Optical Drives: | No |
| Other Hardware: | None |
| Software | |
|---|---|
| Power Management: | Enabled (see SUT Notes) |
| Operating System (OS): | Windows Server 2012 R2 Datacenter |
| OS Version: | 6.3 (Build 9600) |
| Filesystem: | NTFS |
| JVM Vendor: | Oracle Corporation |
| JVM Version: | Java HotSpot(TM) 64-Bit Server VM (build 24.80-b11, mixed mode), version 1.7.0_80 |
| JVM Command-line Options: | -server -Xmn19g -Xms21g -Xmx21g -XX:SurvivorRatio=1 -XX:TargetSurvivorRatio=99 -XX:ParallelGCThreads=28 -XX:AllocatePrefetchDistance=256 -XX:AllocatePrefetchLines=4 -XX:LoopUnrollLimit=45 -XX:InitialTenuringThreshold=12 -XX:MaxTenuringThreshold=15 -XX:InlineSmallCode=9000 -XX:MaxInlineSize=270 -XX:FreqInlineSize=6000 -XX:+UseLargePages -XX:+UseParallelOldGC -XX:+AggressiveOpts |
| JVM Affinity: | start /NODE [0,1,2,3] /AFFINITY [0xFFFFFFF] |
| JVM Instances: | 4 |
| JVM Initial Heap (MB): | 21000 |
| JVM Maximum Heap (MB): | 21000 |
| JVM Address Bits: | 64 |
| Boot Firmware Version: | I42 v1.32 (02/01/2018) |
| Management Firmware Version: | 1.15 Aug 17 2017 |
| Workload Version: | SSJ 1.2.10 |
| Director Location: | Controller |
| Other Software: | HPE Composer Version 3.10.07 (HPE OneView) with HPE Synergy Custom SPP Bundle 2017.10.20180323; Microsoft Windows KB4054519, KB4056898 |
| JVM Instance | ssj_ops@100% |
|---|---|
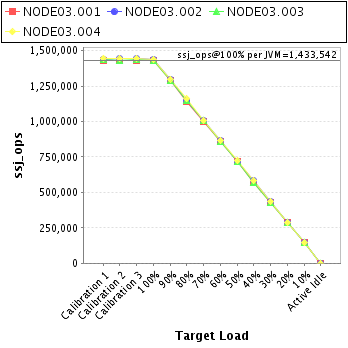
| NODE03.001 | 1,427,968 |
| NODE03.002 | 1,437,916 |
| NODE03.003 | 1,429,636 |
| NODE03.004 | 1,438,651 |
| ssj_ops@100% | 5,734,170 |
| ssj_ops@100% per JVM | 1,433,542 |
| Target Load | Actual Load | ssj_ops | |
|---|---|---|---|
| Target | Actual | ||
| Calibration 1 | 1,430,913 | ||
| Calibration 2 | 1,429,214 | ||
| Calibration 3 | 1,429,572 | ||
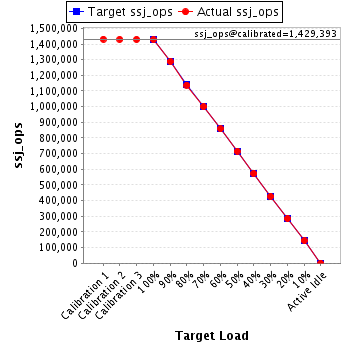
| ssj_ops@calibrated=1,429,393 | |||
| 100% | 99.9% | 1,429,393 | 1,427,968 |
| 90% | 90.1% | 1,286,454 | 1,288,069 |
| 80% | 79.6% | 1,143,514 | 1,138,013 |
| 70% | 70.0% | 1,000,575 | 1,000,012 |
| 60% | 60.0% | 857,636 | 858,245 |
| 50% | 50.1% | 714,697 | 716,139 |
| 40% | 40.1% | 571,757 | 572,509 |
| 30% | 29.9% | 428,818 | 427,109 |
| 20% | 19.9% | 285,879 | 285,150 |
| 10% | 10.1% | 142,939 | 144,659 |
| Active Idle | 0 | 0 | |
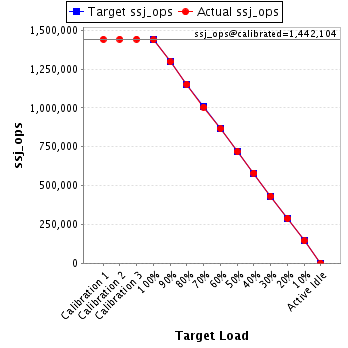
| Target Load | Actual Load | ssj_ops | |
|---|---|---|---|
| Target | Actual | ||
| Calibration 1 | 1,440,922 | ||
| Calibration 2 | 1,441,814 | ||
| Calibration 3 | 1,442,394 | ||
| ssj_ops@calibrated=1,442,104 | |||
| 100% | 99.7% | 1,442,104 | 1,437,916 |
| 90% | 89.9% | 1,297,894 | 1,296,958 |
| 80% | 79.8% | 1,153,683 | 1,151,199 |
| 70% | 69.7% | 1,009,473 | 1,005,398 |
| 60% | 60.0% | 865,263 | 865,547 |
| 50% | 49.8% | 721,052 | 718,376 |
| 40% | 40.2% | 576,842 | 580,381 |
| 30% | 30.0% | 432,631 | 432,771 |
| 20% | 20.0% | 288,421 | 288,662 |
| 10% | 10.1% | 144,210 | 145,070 |
| Active Idle | 0 | 0 | |
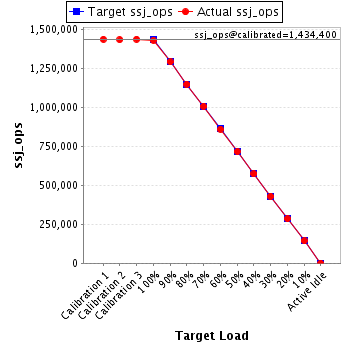
| Target Load | Actual Load | ssj_ops | |
|---|---|---|---|
| Target | Actual | ||
| Calibration 1 | 1,435,552 | ||
| Calibration 2 | 1,432,460 | ||
| Calibration 3 | 1,436,339 | ||
| ssj_ops@calibrated=1,434,400 | |||
| 100% | 99.7% | 1,434,400 | 1,429,636 |
| 90% | 90.0% | 1,290,960 | 1,290,515 |
| 80% | 80.0% | 1,147,520 | 1,147,585 |
| 70% | 70.2% | 1,004,080 | 1,007,118 |
| 60% | 60.0% | 860,640 | 859,932 |
| 50% | 49.9% | 717,200 | 715,609 |
| 40% | 39.9% | 573,760 | 572,409 |
| 30% | 29.9% | 430,320 | 429,584 |
| 20% | 19.8% | 286,880 | 284,503 |
| 10% | 10.0% | 143,440 | 143,366 |
| Active Idle | 0 | 0 | |
| Target Load | Actual Load | ssj_ops | |
|---|---|---|---|
| Target | Actual | ||
| Calibration 1 | 1,446,737 | ||
| Calibration 2 | 1,441,652 | ||
| Calibration 3 | 1,445,838 | ||
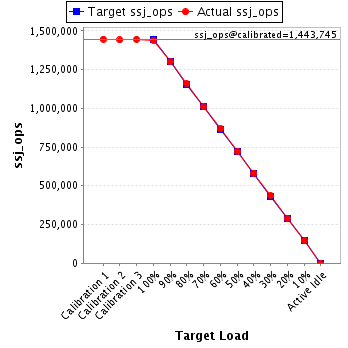
| ssj_ops@calibrated=1,443,745 | |||
| 100% | 99.6% | 1,443,745 | 1,438,651 |
| 90% | 90.0% | 1,299,371 | 1,299,725 |
| 80% | 80.3% | 1,154,996 | 1,158,941 |
| 70% | 69.9% | 1,010,622 | 1,009,078 |
| 60% | 60.1% | 866,247 | 867,304 |
| 50% | 50.1% | 721,873 | 722,676 |
| 40% | 40.3% | 577,498 | 582,169 |
| 30% | 30.3% | 433,124 | 436,941 |
| 20% | 20.0% | 288,749 | 288,521 |
| 10% | 10.1% | 144,375 | 145,225 |
| Active Idle | 0 | 0 | |