SPECpower_ssj2008
Host 'NODE02' Performance Report
Copyright © 2007-2018 Standard Performance Evaluation Corporation
| Hewlett Packard Enterprise Synergy 480 Gen10 Compute Module | ssj_ops@100% = 5,728,244 ssj_ops@100% per JVM = 1,432,061 |
||||
| Test Sponsor: | Hewlett Packard Enterprise | SPEC License #: | 3 | Test Method: | Multi Node |
| Tested By: | Hewlett Packard Enterprise | Test Location: | Houston, TX, USA | Test Date: | Aug 24, 2018 |
| Hardware Availability: | Jun-2018 | Software Availability: | Mar-2018 | Publication: | Sep 12, 2018 |
| System Source: | Single Supplier | System Designation: | Server | Power Provisioning: | Line-powered |
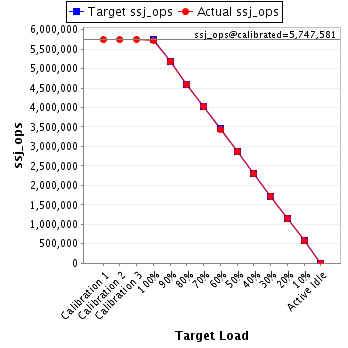
| Target Load | Actual Load | ssj_ops | |
|---|---|---|---|
| Target | Actual | ||
| Calibration 1 | 5,742,794 | ||
| Calibration 2 | 5,740,402 | ||
| Calibration 3 | 5,754,760 | ||
| ssj_ops@calibrated=5,747,581 | |||
| 100% | 99.7% | 5,747,581 | 5,728,244 |
| 90% | 90.1% | 5,172,823 | 5,175,749 |
| 80% | 80.0% | 4,598,065 | 4,597,526 |
| 70% | 70.0% | 4,023,307 | 4,022,776 |
| 60% | 59.9% | 3,448,549 | 3,444,575 |
| 50% | 50.1% | 2,873,790 | 2,877,578 |
| 40% | 40.1% | 2,299,032 | 2,302,305 |
| 30% | 29.9% | 1,724,274 | 1,721,258 |
| 20% | 19.9% | 1,149,516 | 1,146,545 |
| 10% | 10.0% | 574,758 | 573,925 |
| Active Idle | 0 | 0 | |
| Set Identifier: | SUT |
| Set Description: | System Under Test |
| # of Identical Nodes: | 10 |
| Comment: | SUT |
| Hardware | |
|---|---|
| Hardware Vendor: | Hewlett Packard Enterprise |
| Model: | Synergy 480 Gen10 Compute Module |
| Form Factor: | Other |
| CPU Name: | Intel Xeon Platinum 8180 2.50GHz |
| CPU Characteristics: | 28-Core, 2.50 GHz, 38.5 MB L3 Cache |
| CPU Frequency (MHz): | 2500 |
| CPU(s) Enabled: | 56 cores, 2 chips, 28 cores/chip |
| Hardware Threads: | 112 (2 / core) |
| CPU(s) Orderable: | 1,2 chips |
| Primary Cache: | 32 KB I + 32 KB D on chip per core |
| Secondary Cache: | 1 MB I+D on chip per core |
| Tertiary Cache: | 39424 KB I+D on chip per chip |
| Other Cache: | None |
| Memory Amount (GB): | 192 |
| # and size of DIMM: | 12 x 16384 MB |
| Memory Details: | 12 x 16GB 2Rx8 PC4-2666-V ECC; slots 1, 3, 5, 8, 10 and 12 populated on each CPU socket |
| Power Supply Quantity and Rating (W): | None |
| Power Supply Details: | Shared |
| Disk Drive: | 1 x HPE Synergy 480 Gen10 M.2 FIO Adapter Board Kit (873165-B21); 1 x HPE 480GB SATA 6G Read Intensive M.2 2280 SSD (875498-B21) |
| Disk Controller: | 1 x HPE Smart Array S100i SR Gen10 |
| # and type of Network Interface Cards (NICs) Installed: | 1 x HPE Synergy 3820C 10/20Gb 2-port Converged Network Adapter (777430-B21) |
| NICs Enabled in Firmware / OS / Connected: | 2/1/1 |
| Network Speed (Mbit): | 10000 |
| Keyboard: | None |
| Mouse: | None |
| Monitor: | None |
| Optical Drives: | No |
| Other Hardware: | None |
| Software | |
|---|---|
| Power Management: | Enabled (see SUT Notes) |
| Operating System (OS): | Windows Server 2012 R2 Datacenter |
| OS Version: | 6.3 (Build 9600) |
| Filesystem: | NTFS |
| JVM Vendor: | Oracle Corporation |
| JVM Version: | Java HotSpot(TM) 64-Bit Server VM (build 24.80-b11, mixed mode), version 1.7.0_80 |
| JVM Command-line Options: | -server -Xmn19g -Xms21g -Xmx21g -XX:SurvivorRatio=1 -XX:TargetSurvivorRatio=99 -XX:ParallelGCThreads=28 -XX:AllocatePrefetchDistance=256 -XX:AllocatePrefetchLines=4 -XX:LoopUnrollLimit=45 -XX:InitialTenuringThreshold=12 -XX:MaxTenuringThreshold=15 -XX:InlineSmallCode=9000 -XX:MaxInlineSize=270 -XX:FreqInlineSize=6000 -XX:+UseLargePages -XX:+UseParallelOldGC -XX:+AggressiveOpts |
| JVM Affinity: | start /NODE [0,1,2,3] /AFFINITY [0xFFFFFFF] |
| JVM Instances: | 4 |
| JVM Initial Heap (MB): | 21000 |
| JVM Maximum Heap (MB): | 21000 |
| JVM Address Bits: | 64 |
| Boot Firmware Version: | I42 v1.32 (02/01/2018) |
| Management Firmware Version: | 1.15 Aug 17 2017 |
| Workload Version: | SSJ 1.2.10 |
| Director Location: | Controller |
| Other Software: | HPE Composer Version 3.10.07 (HPE OneView) with HPE Synergy Custom SPP Bundle 2017.10.20180323; Microsoft Windows KB4054519, KB4056898 |
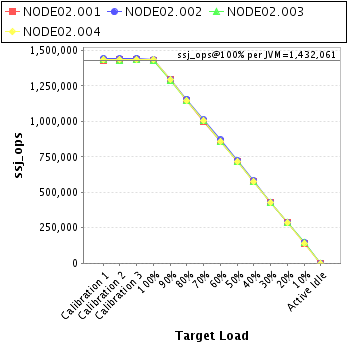
| JVM Instance | ssj_ops@100% |
|---|---|
| NODE02.001 | 1,429,718 |
| NODE02.002 | 1,433,527 |
| NODE02.003 | 1,432,324 |
| NODE02.004 | 1,432,676 |
| ssj_ops@100% | 5,728,244 |
| ssj_ops@100% per JVM | 1,432,061 |
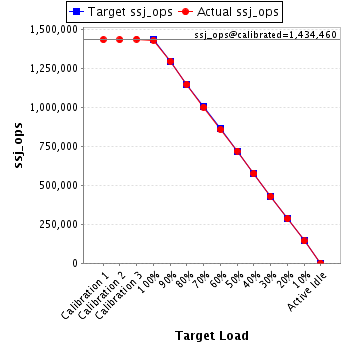
| Target Load | Actual Load | ssj_ops | |
|---|---|---|---|
| Target | Actual | ||
| Calibration 1 | 1,432,482 | ||
| Calibration 2 | 1,432,607 | ||
| Calibration 3 | 1,436,313 | ||
| ssj_ops@calibrated=1,434,460 | |||
| 100% | 99.7% | 1,434,460 | 1,429,718 |
| 90% | 90.2% | 1,291,014 | 1,294,520 |
| 80% | 79.9% | 1,147,568 | 1,146,079 |
| 70% | 69.8% | 1,004,122 | 1,000,687 |
| 60% | 59.7% | 860,676 | 856,944 |
| 50% | 50.2% | 717,230 | 719,441 |
| 40% | 40.0% | 573,784 | 574,046 |
| 30% | 29.9% | 430,338 | 429,092 |
| 20% | 19.9% | 286,892 | 285,240 |
| 10% | 10.0% | 143,446 | 142,762 |
| Active Idle | 0 | 0 | |
| Target Load | Actual Load | ssj_ops | |
|---|---|---|---|
| Target | Actual | ||
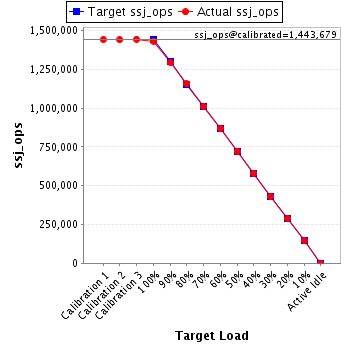
| Calibration 1 | 1,442,711 | ||
| Calibration 2 | 1,441,961 | ||
| Calibration 3 | 1,445,398 | ||
| ssj_ops@calibrated=1,443,679 | |||
| 100% | 99.3% | 1,443,679 | 1,433,527 |
| 90% | 89.8% | 1,299,311 | 1,296,483 |
| 80% | 80.2% | 1,154,943 | 1,157,385 |
| 70% | 70.0% | 1,010,575 | 1,010,606 |
| 60% | 60.2% | 866,208 | 868,905 |
| 50% | 50.1% | 721,840 | 722,732 |
| 40% | 40.2% | 577,472 | 579,823 |
| 30% | 29.9% | 433,104 | 431,039 |
| 20% | 20.0% | 288,736 | 288,451 |
| 10% | 10.0% | 144,368 | 145,084 |
| Active Idle | 0 | 0 | |
| Target Load | Actual Load | ssj_ops | |
|---|---|---|---|
| Target | Actual | ||
| Calibration 1 | 1,433,530 | ||
| Calibration 2 | 1,431,718 | ||
| Calibration 3 | 1,436,038 | ||
| ssj_ops@calibrated=1,433,878 | |||
| 100% | 99.9% | 1,433,878 | 1,432,324 |
| 90% | 90.0% | 1,290,490 | 1,291,017 |
| 80% | 80.2% | 1,147,102 | 1,150,284 |
| 70% | 70.2% | 1,003,715 | 1,006,334 |
| 60% | 59.8% | 860,327 | 857,431 |
| 50% | 50.1% | 716,939 | 719,059 |
| 40% | 40.0% | 573,551 | 573,309 |
| 30% | 30.1% | 430,163 | 431,176 |
| 20% | 20.1% | 286,776 | 287,967 |
| 10% | 10.0% | 143,388 | 144,100 |
| Active Idle | 0 | 0 | |

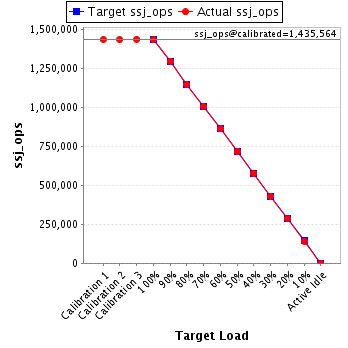
| Target Load | Actual Load | ssj_ops | |
|---|---|---|---|
| Target | Actual | ||
| Calibration 1 | 1,434,071 | ||
| Calibration 2 | 1,434,116 | ||
| Calibration 3 | 1,437,012 | ||
| ssj_ops@calibrated=1,435,564 | |||
| 100% | 99.8% | 1,435,564 | 1,432,676 |
| 90% | 90.1% | 1,292,008 | 1,293,730 |
| 80% | 79.7% | 1,148,451 | 1,143,778 |
| 70% | 70.0% | 1,004,895 | 1,005,150 |
| 60% | 60.0% | 861,338 | 861,295 |
| 50% | 49.9% | 717,782 | 716,345 |
| 40% | 40.1% | 574,226 | 575,127 |
| 30% | 30.0% | 430,669 | 429,952 |
| 20% | 19.8% | 287,113 | 284,887 |
| 10% | 9.9% | 143,556 | 141,979 |
| Active Idle | 0 | 0 | |