SPECpower_ssj2008
Host 'NODE01' Performance Report
Copyright © 2007-2018 Standard Performance Evaluation Corporation
| Hewlett Packard Enterprise Synergy 480 Gen10 Compute Module | ssj_ops@100% = 5,735,419 ssj_ops@100% per JVM = 1,433,855 |
||||
| Test Sponsor: | Hewlett Packard Enterprise | SPEC License #: | 3 | Test Method: | Multi Node |
| Tested By: | Hewlett Packard Enterprise | Test Location: | Houston, TX, USA | Test Date: | Aug 24, 2018 |
| Hardware Availability: | Jun-2018 | Software Availability: | Mar-2018 | Publication: | Sep 12, 2018 |
| System Source: | Single Supplier | System Designation: | Server | Power Provisioning: | Line-powered |
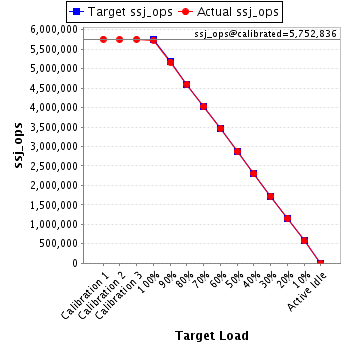
| Target Load | Actual Load | ssj_ops | |
|---|---|---|---|
| Target | Actual | ||
| Calibration 1 | 5,757,011 | ||
| Calibration 2 | 5,749,653 | ||
| Calibration 3 | 5,756,018 | ||
| ssj_ops@calibrated=5,752,836 | |||
| 100% | 99.7% | 5,752,836 | 5,735,419 |
| 90% | 89.9% | 5,177,552 | 5,170,442 |
| 80% | 80.0% | 4,602,268 | 4,601,878 |
| 70% | 70.0% | 4,026,985 | 4,027,126 |
| 60% | 60.0% | 3,451,701 | 3,453,848 |
| 50% | 50.0% | 2,876,418 | 2,877,791 |
| 40% | 40.0% | 2,301,134 | 2,299,592 |
| 30% | 30.0% | 1,725,851 | 1,727,140 |
| 20% | 20.0% | 1,150,567 | 1,149,094 |
| 10% | 10.0% | 575,284 | 575,639 |
| Active Idle | 0 | 0 | |
| Set Identifier: | SUT |
| Set Description: | System Under Test |
| # of Identical Nodes: | 10 |
| Comment: | SUT |
| Hardware | |
|---|---|
| Hardware Vendor: | Hewlett Packard Enterprise |
| Model: | Synergy 480 Gen10 Compute Module |
| Form Factor: | Other |
| CPU Name: | Intel Xeon Platinum 8180 2.50GHz |
| CPU Characteristics: | 28-Core, 2.50 GHz, 38.5 MB L3 Cache |
| CPU Frequency (MHz): | 2500 |
| CPU(s) Enabled: | 56 cores, 2 chips, 28 cores/chip |
| Hardware Threads: | 112 (2 / core) |
| CPU(s) Orderable: | 1,2 chips |
| Primary Cache: | 32 KB I + 32 KB D on chip per core |
| Secondary Cache: | 1 MB I+D on chip per core |
| Tertiary Cache: | 39424 KB I+D on chip per chip |
| Other Cache: | None |
| Memory Amount (GB): | 192 |
| # and size of DIMM: | 12 x 16384 MB |
| Memory Details: | 12 x 16GB 2Rx8 PC4-2666-V ECC; slots 1, 3, 5, 8, 10 and 12 populated on each CPU socket |
| Power Supply Quantity and Rating (W): | None |
| Power Supply Details: | Shared |
| Disk Drive: | 1 x HPE Synergy 480 Gen10 M.2 FIO Adapter Board Kit (873165-B21); 1 x HPE 480GB SATA 6G Read Intensive M.2 2280 SSD (875498-B21) |
| Disk Controller: | 1 x HPE Smart Array S100i SR Gen10 |
| # and type of Network Interface Cards (NICs) Installed: | 1 x HPE Synergy 3820C 10/20Gb 2-port Converged Network Adapter (777430-B21) |
| NICs Enabled in Firmware / OS / Connected: | 2/1/1 |
| Network Speed (Mbit): | 10000 |
| Keyboard: | None |
| Mouse: | None |
| Monitor: | None |
| Optical Drives: | No |
| Other Hardware: | None |
| Software | |
|---|---|
| Power Management: | Enabled (see SUT Notes) |
| Operating System (OS): | Windows Server 2012 R2 Datacenter |
| OS Version: | 6.3 (Build 9600) |
| Filesystem: | NTFS |
| JVM Vendor: | Oracle Corporation |
| JVM Version: | Java HotSpot(TM) 64-Bit Server VM (build 24.80-b11, mixed mode), version 1.7.0_80 |
| JVM Command-line Options: | -server -Xmn19g -Xms21g -Xmx21g -XX:SurvivorRatio=1 -XX:TargetSurvivorRatio=99 -XX:ParallelGCThreads=28 -XX:AllocatePrefetchDistance=256 -XX:AllocatePrefetchLines=4 -XX:LoopUnrollLimit=45 -XX:InitialTenuringThreshold=12 -XX:MaxTenuringThreshold=15 -XX:InlineSmallCode=9000 -XX:MaxInlineSize=270 -XX:FreqInlineSize=6000 -XX:+UseLargePages -XX:+UseParallelOldGC -XX:+AggressiveOpts |
| JVM Affinity: | start /NODE [0,1,2,3] /AFFINITY [0xFFFFFFF] |
| JVM Instances: | 4 |
| JVM Initial Heap (MB): | 21000 |
| JVM Maximum Heap (MB): | 21000 |
| JVM Address Bits: | 64 |
| Boot Firmware Version: | I42 v1.32 (02/01/2018) |
| Management Firmware Version: | 1.15 Aug 17 2017 |
| Workload Version: | SSJ 1.2.10 |
| Director Location: | Controller |
| Other Software: | HPE Composer Version 3.10.07 (HPE OneView) with HPE Synergy Custom SPP Bundle 2017.10.20180323; Microsoft Windows KB4054519, KB4056898 |
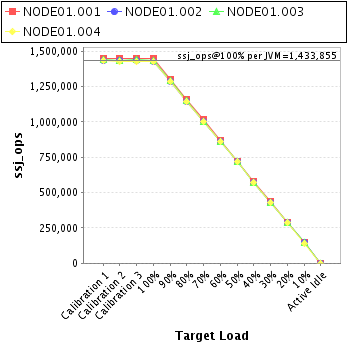
| JVM Instance | ssj_ops@100% |
|---|---|
| NODE01.001 | 1,446,533 |
| NODE01.002 | 1,428,657 |
| NODE01.003 | 1,433,174 |
| NODE01.004 | 1,427,055 |
| ssj_ops@100% | 5,735,419 |
| ssj_ops@100% per JVM | 1,433,855 |
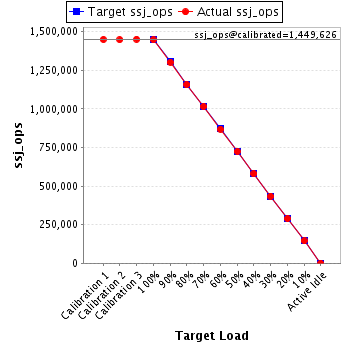
| Target Load | Actual Load | ssj_ops | |
|---|---|---|---|
| Target | Actual | ||
| Calibration 1 | 1,448,816 | ||
| Calibration 2 | 1,447,906 | ||
| Calibration 3 | 1,451,345 | ||
| ssj_ops@calibrated=1,449,626 | |||
| 100% | 99.8% | 1,449,626 | 1,446,533 |
| 90% | 89.8% | 1,304,663 | 1,302,071 |
| 80% | 79.8% | 1,159,700 | 1,156,849 |
| 70% | 70.1% | 1,014,738 | 1,015,892 |
| 60% | 59.9% | 869,775 | 868,359 |
| 50% | 49.9% | 724,813 | 723,694 |
| 40% | 39.9% | 579,850 | 578,717 |
| 30% | 30.0% | 434,888 | 435,025 |
| 20% | 19.9% | 289,925 | 288,279 |
| 10% | 10.0% | 144,963 | 144,766 |
| Active Idle | 0 | 0 | |
| Target Load | Actual Load | ssj_ops | |
|---|---|---|---|
| Target | Actual | ||
| Calibration 1 | 1,432,960 | ||
| Calibration 2 | 1,432,982 | ||
| Calibration 3 | 1,434,138 | ||
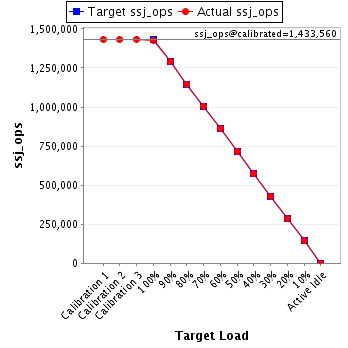
| ssj_ops@calibrated=1,433,560 | |||
| 100% | 99.7% | 1,433,560 | 1,428,657 |
| 90% | 90.0% | 1,290,204 | 1,289,603 |
| 80% | 79.9% | 1,146,848 | 1,146,101 |
| 70% | 70.0% | 1,003,492 | 1,003,771 |
| 60% | 60.0% | 860,136 | 860,467 |
| 50% | 50.0% | 716,780 | 716,628 |
| 40% | 40.0% | 573,424 | 572,743 |
| 30% | 30.0% | 430,068 | 429,962 |
| 20% | 20.0% | 286,712 | 286,024 |
| 10% | 10.1% | 143,356 | 145,005 |
| Active Idle | 0 | 0 | |
| Target Load | Actual Load | ssj_ops | |
|---|---|---|---|
| Target | Actual | ||
| Calibration 1 | 1,440,335 | ||
| Calibration 2 | 1,437,840 | ||
| Calibration 3 | 1,439,874 | ||
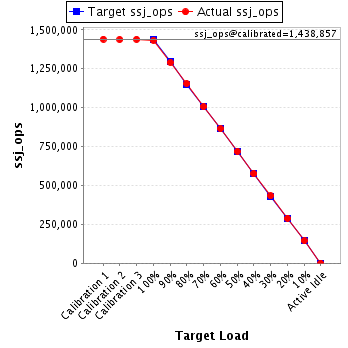
| ssj_ops@calibrated=1,438,857 | |||
| 100% | 99.6% | 1,438,857 | 1,433,174 |
| 90% | 89.7% | 1,294,971 | 1,290,052 |
| 80% | 80.3% | 1,151,085 | 1,155,315 |
| 70% | 69.9% | 1,007,200 | 1,006,391 |
| 60% | 60.1% | 863,314 | 864,529 |
| 50% | 50.0% | 719,428 | 718,789 |
| 40% | 40.0% | 575,543 | 575,062 |
| 30% | 30.1% | 431,657 | 432,527 |
| 20% | 20.1% | 287,771 | 289,099 |
| 10% | 10.0% | 143,886 | 144,572 |
| Active Idle | 0 | 0 | |
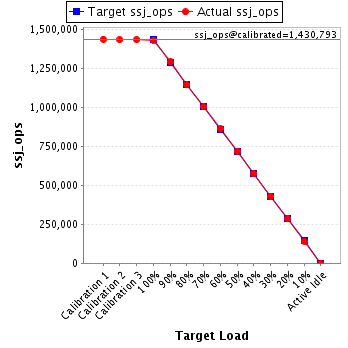
| Target Load | Actual Load | ssj_ops | |
|---|---|---|---|
| Target | Actual | ||
| Calibration 1 | 1,434,901 | ||
| Calibration 2 | 1,430,925 | ||
| Calibration 3 | 1,430,662 | ||
| ssj_ops@calibrated=1,430,793 | |||
| 100% | 99.7% | 1,430,793 | 1,427,055 |
| 90% | 90.1% | 1,287,714 | 1,288,716 |
| 80% | 79.9% | 1,144,635 | 1,143,612 |
| 70% | 70.0% | 1,001,555 | 1,001,071 |
| 60% | 60.1% | 858,476 | 860,493 |
| 50% | 50.2% | 715,397 | 718,680 |
| 40% | 40.1% | 572,317 | 573,070 |
| 30% | 30.0% | 429,238 | 429,626 |
| 20% | 20.0% | 286,159 | 285,692 |
| 10% | 9.9% | 143,079 | 141,296 |
| Active Idle | 0 | 0 | |