SPECpower_ssj2008
Host 'NODE10' Performance Report
Copyright © 2007-2018 Standard Performance Evaluation Corporation
| Hewlett Packard Enterprise Synergy 480 Gen10 Compute Module | ssj_ops@100% = 5,716,109 ssj_ops@100% per JVM = 1,429,027 |
||||
| Test Sponsor: | Hewlett Packard Enterprise | SPEC License #: | 3 | Test Method: | Multi Node |
| Tested By: | Hewlett Packard Enterprise | Test Location: | Houston, TX, USA | Test Date: | Aug 26, 2018 |
| Hardware Availability: | Jun-2018 | Software Availability: | Mar-2018 | Publication: | Sep 12, 2018 |
| System Source: | Single Supplier | System Designation: | Server | Power Provisioning: | Line-powered |
| Target Load | Actual Load | ssj_ops | |
|---|---|---|---|
| Target | Actual | ||
| Calibration 1 | 5,748,107 | ||
| Calibration 2 | 5,738,931 | ||
| Calibration 3 | 5,748,939 | ||
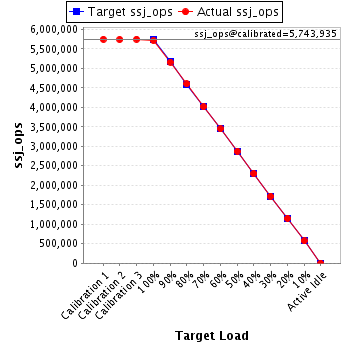
| ssj_ops@calibrated=5,743,935 | |||
| 100% | 99.5% | 5,743,935 | 5,716,109 |
| 90% | 89.8% | 5,169,542 | 5,160,694 |
| 80% | 80.1% | 4,595,148 | 4,603,492 |
| 70% | 69.9% | 4,020,755 | 4,014,219 |
| 60% | 60.0% | 3,446,361 | 3,444,570 |
| 50% | 50.0% | 2,871,968 | 2,873,743 |
| 40% | 40.0% | 2,297,574 | 2,296,823 |
| 30% | 30.0% | 1,723,181 | 1,722,865 |
| 20% | 20.0% | 1,148,787 | 1,150,379 |
| 10% | 10.0% | 574,394 | 574,845 |
| Active Idle | 0 | 0 | |
| Set Identifier: | SUT |
| Set Description: | System Under Test |
| # of Identical Nodes: | 11 |
| Comment: | SUT |
| Hardware | |
|---|---|
| Hardware Vendor: | Hewlett Packard Enterprise |
| Model: | Synergy 480 Gen10 Compute Module |
| Form Factor: | Other |
| CPU Name: | Intel Xeon Platinum 8180 2.50GHz |
| CPU Characteristics: | 28-Core, 2.50 GHz, 38.5 MB L3 Cache |
| CPU Frequency (MHz): | 2500 |
| CPU(s) Enabled: | 56 cores, 2 chips, 28 cores/chip |
| Hardware Threads: | 112 (2 / core) |
| CPU(s) Orderable: | 1,2 chips |
| Primary Cache: | 32 KB I + 32 KB D on chip per core |
| Secondary Cache: | 1 MB I+D on chip per core |
| Tertiary Cache: | 39424 KB I+D on chip per chip |
| Other Cache: | None |
| Memory Amount (GB): | 192 |
| # and size of DIMM: | 12 x 16384 MB |
| Memory Details: | 12 x 16GB 2Rx8 PC4-2666-V ECC; slots 1, 3, 5, 8, 10 and 12 populated on each CPU socket |
| Power Supply Quantity and Rating (W): | None |
| Power Supply Details: | Shared |
| Disk Drive: | 1 x HPE Synergy 480 Gen10 M.2 FIO Adapter Board Kit (873165-B21); 1 x HPE 480GB SATA 6G Read Intensive M.2 2280 SSD (875498-B21) |
| Disk Controller: | 1 x HPE Smart Array S100i SR Gen10 |
| # and type of Network Interface Cards (NICs) Installed: | 1 x HPE Synergy 3820C 10/20Gb 2-port Converged Network Adapter (777430-B21) |
| NICs Enabled in Firmware / OS / Connected: | 2/1/1 |
| Network Speed (Mbit): | 10000 |
| Keyboard: | None |
| Mouse: | None |
| Monitor: | None |
| Optical Drives: | No |
| Other Hardware: | None |
| Software | |
|---|---|
| Power Management: | Enabled (see SUT Notes) |
| Operating System (OS): | Windows Server 2012 R2 Datacenter |
| OS Version: | 6.3 (Build 9600) |
| Filesystem: | NTFS |
| JVM Vendor: | Oracle Corporation |
| JVM Version: | Java HotSpot(TM) 64-Bit Server VM (build 24.80-b11, mixed mode), version 1.7.0_80 |
| JVM Command-line Options: | -server -Xmn19g -Xms21g -Xmx21g -XX:SurvivorRatio=1 -XX:TargetSurvivorRatio=99 -XX:ParallelGCThreads=28 -XX:AllocatePrefetchDistance=256 -XX:AllocatePrefetchLines=4 -XX:LoopUnrollLimit=45 -XX:InitialTenuringThreshold=12 -XX:MaxTenuringThreshold=15 -XX:InlineSmallCode=9000 -XX:MaxInlineSize=270 -XX:FreqInlineSize=6000 -XX:+UseLargePages -XX:+UseParallelOldGC -XX:+AggressiveOpts |
| JVM Affinity: | start /NODE [0,1,2,3] /AFFINITY [0xFFFFFFF] |
| JVM Instances: | 4 |
| JVM Initial Heap (MB): | 21000 |
| JVM Maximum Heap (MB): | 21000 |
| JVM Address Bits: | 64 |
| Boot Firmware Version: | I42 v1.32 (02/01/2018) |
| Management Firmware Version: | 1.15 Aug 17 2017 |
| Workload Version: | SSJ 1.2.10 |
| Director Location: | Controller |
| Other Software: | HPE Composer Version 3.10.07 (HPE OneView) with HPE Synergy Custom SPP Bundle 2017.10.20180323; Microsoft Windows KB4054519, KB4056898 |
| JVM Instance | ssj_ops@100% |
|---|---|
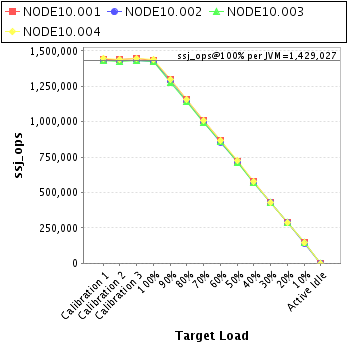
| NODE10.001 | 1,434,097 |
| NODE10.002 | 1,424,015 |
| NODE10.003 | 1,421,447 |
| NODE10.004 | 1,436,550 |
| ssj_ops@100% | 5,716,109 |
| ssj_ops@100% per JVM | 1,429,027 |
| Target Load | Actual Load | ssj_ops | |
|---|---|---|---|
| Target | Actual | ||
| Calibration 1 | 1,440,171 | ||
| Calibration 2 | 1,439,273 | ||
| Calibration 3 | 1,444,413 | ||
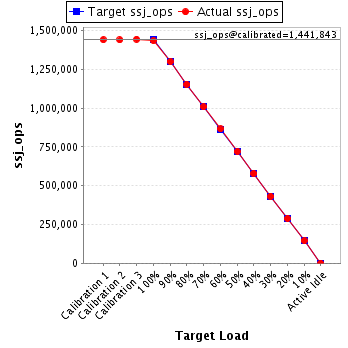
| ssj_ops@calibrated=1,441,843 | |||
| 100% | 99.5% | 1,441,843 | 1,434,097 |
| 90% | 90.1% | 1,297,659 | 1,299,792 |
| 80% | 80.0% | 1,153,475 | 1,153,201 |
| 70% | 69.9% | 1,009,290 | 1,008,044 |
| 60% | 60.0% | 865,106 | 865,685 |
| 50% | 50.0% | 720,922 | 720,216 |
| 40% | 40.1% | 576,737 | 577,756 |
| 30% | 30.0% | 432,553 | 431,871 |
| 20% | 20.0% | 288,369 | 287,767 |
| 10% | 10.1% | 144,184 | 145,462 |
| Active Idle | 0 | 0 | |
| Target Load | Actual Load | ssj_ops | |
|---|---|---|---|
| Target | Actual | ||
| Calibration 1 | 1,431,538 | ||
| Calibration 2 | 1,432,095 | ||
| Calibration 3 | 1,430,391 | ||
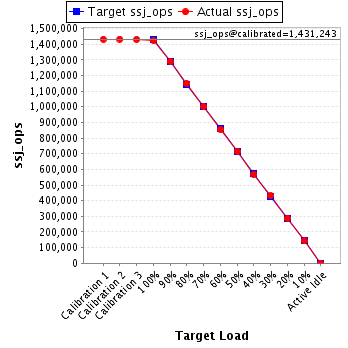
| ssj_ops@calibrated=1,431,243 | |||
| 100% | 99.5% | 1,431,243 | 1,424,015 |
| 90% | 90.0% | 1,288,119 | 1,288,439 |
| 80% | 80.3% | 1,144,994 | 1,148,618 |
| 70% | 69.9% | 1,001,870 | 1,000,098 |
| 60% | 59.8% | 858,746 | 855,561 |
| 50% | 50.0% | 715,622 | 715,871 |
| 40% | 39.8% | 572,497 | 570,105 |
| 30% | 30.1% | 429,373 | 430,405 |
| 20% | 20.0% | 286,249 | 286,962 |
| 10% | 9.9% | 143,124 | 142,367 |
| Active Idle | 0 | 0 | |
| Target Load | Actual Load | ssj_ops | |
|---|---|---|---|
| Target | Actual | ||
| Calibration 1 | 1,428,375 | ||
| Calibration 2 | 1,426,559 | ||
| Calibration 3 | 1,429,155 | ||
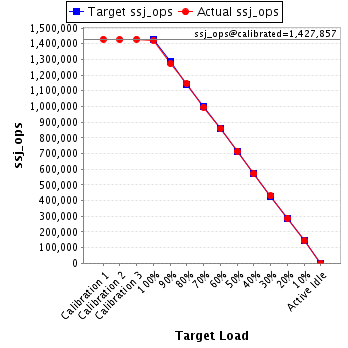
| ssj_ops@calibrated=1,427,857 | |||
| 100% | 99.6% | 1,427,857 | 1,421,447 |
| 90% | 89.2% | 1,285,071 | 1,273,460 |
| 80% | 80.2% | 1,142,286 | 1,145,500 |
| 70% | 69.8% | 999,500 | 996,486 |
| 60% | 60.1% | 856,714 | 858,366 |
| 50% | 50.0% | 713,929 | 714,133 |
| 40% | 40.0% | 571,143 | 570,697 |
| 30% | 30.0% | 428,357 | 428,963 |
| 20% | 20.1% | 285,571 | 286,970 |
| 10% | 10.0% | 142,786 | 143,347 |
| Active Idle | 0 | 0 | |
| Target Load | Actual Load | ssj_ops | |
|---|---|---|---|
| Target | Actual | ||
| Calibration 1 | 1,448,022 | ||
| Calibration 2 | 1,441,004 | ||
| Calibration 3 | 1,444,979 | ||
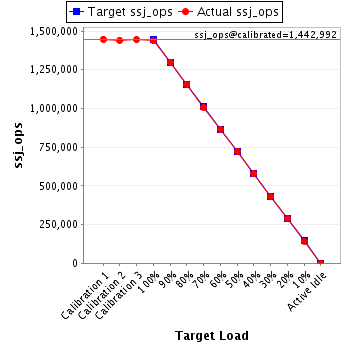
| ssj_ops@calibrated=1,442,992 | |||
| 100% | 99.6% | 1,442,992 | 1,436,550 |
| 90% | 90.0% | 1,298,692 | 1,299,003 |
| 80% | 80.1% | 1,154,393 | 1,156,173 |
| 70% | 70.0% | 1,010,094 | 1,009,591 |
| 60% | 59.9% | 865,795 | 864,958 |
| 50% | 50.1% | 721,496 | 723,523 |
| 40% | 40.1% | 577,197 | 578,265 |
| 30% | 29.9% | 432,897 | 431,626 |
| 20% | 20.0% | 288,598 | 288,681 |
| 10% | 10.0% | 144,299 | 143,669 |
| Active Idle | 0 | 0 | |