SPECpower_ssj2008
Host 'NODE09' Performance Report
Copyright © 2007-2018 Standard Performance Evaluation Corporation
| Hewlett Packard Enterprise Synergy 480 Gen10 Compute Module | ssj_ops@100% = 5,728,556 ssj_ops@100% per JVM = 1,432,139 |
||||
| Test Sponsor: | Hewlett Packard Enterprise | SPEC License #: | 3 | Test Method: | Multi Node |
| Tested By: | Hewlett Packard Enterprise | Test Location: | Houston, TX, USA | Test Date: | Aug 26, 2018 |
| Hardware Availability: | Jun-2018 | Software Availability: | Mar-2018 | Publication: | Sep 12, 2018 |
| System Source: | Single Supplier | System Designation: | Server | Power Provisioning: | Line-powered |
| Target Load | Actual Load | ssj_ops | |
|---|---|---|---|
| Target | Actual | ||
| Calibration 1 | 5,760,787 | ||
| Calibration 2 | 5,755,079 | ||
| Calibration 3 | 5,763,632 | ||
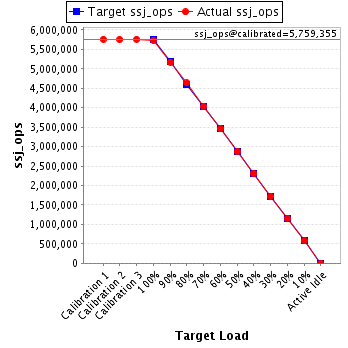
| ssj_ops@calibrated=5,759,355 | |||
| 100% | 99.5% | 5,759,355 | 5,728,556 |
| 90% | 89.9% | 5,183,420 | 5,175,096 |
| 80% | 80.5% | 4,607,484 | 4,637,732 |
| 70% | 70.0% | 4,031,549 | 4,034,338 |
| 60% | 60.0% | 3,455,613 | 3,454,750 |
| 50% | 50.0% | 2,879,678 | 2,880,204 |
| 40% | 40.1% | 2,303,742 | 2,309,532 |
| 30% | 30.0% | 1,727,807 | 1,727,382 |
| 20% | 20.0% | 1,151,871 | 1,150,468 |
| 10% | 10.0% | 575,936 | 576,829 |
| Active Idle | 0 | 0 | |
| Set Identifier: | SUT |
| Set Description: | System Under Test |
| # of Identical Nodes: | 11 |
| Comment: | SUT |
| Hardware | |
|---|---|
| Hardware Vendor: | Hewlett Packard Enterprise |
| Model: | Synergy 480 Gen10 Compute Module |
| Form Factor: | Other |
| CPU Name: | Intel Xeon Platinum 8180 2.50GHz |
| CPU Characteristics: | 28-Core, 2.50 GHz, 38.5 MB L3 Cache |
| CPU Frequency (MHz): | 2500 |
| CPU(s) Enabled: | 56 cores, 2 chips, 28 cores/chip |
| Hardware Threads: | 112 (2 / core) |
| CPU(s) Orderable: | 1,2 chips |
| Primary Cache: | 32 KB I + 32 KB D on chip per core |
| Secondary Cache: | 1 MB I+D on chip per core |
| Tertiary Cache: | 39424 KB I+D on chip per chip |
| Other Cache: | None |
| Memory Amount (GB): | 192 |
| # and size of DIMM: | 12 x 16384 MB |
| Memory Details: | 12 x 16GB 2Rx8 PC4-2666-V ECC; slots 1, 3, 5, 8, 10 and 12 populated on each CPU socket |
| Power Supply Quantity and Rating (W): | None |
| Power Supply Details: | Shared |
| Disk Drive: | 1 x HPE Synergy 480 Gen10 M.2 FIO Adapter Board Kit (873165-B21); 1 x HPE 480GB SATA 6G Read Intensive M.2 2280 SSD (875498-B21) |
| Disk Controller: | 1 x HPE Smart Array S100i SR Gen10 |
| # and type of Network Interface Cards (NICs) Installed: | 1 x HPE Synergy 3820C 10/20Gb 2-port Converged Network Adapter (777430-B21) |
| NICs Enabled in Firmware / OS / Connected: | 2/1/1 |
| Network Speed (Mbit): | 10000 |
| Keyboard: | None |
| Mouse: | None |
| Monitor: | None |
| Optical Drives: | No |
| Other Hardware: | None |
| Software | |
|---|---|
| Power Management: | Enabled (see SUT Notes) |
| Operating System (OS): | Windows Server 2012 R2 Datacenter |
| OS Version: | 6.3 (Build 9600) |
| Filesystem: | NTFS |
| JVM Vendor: | Oracle Corporation |
| JVM Version: | Java HotSpot(TM) 64-Bit Server VM (build 24.80-b11, mixed mode), version 1.7.0_80 |
| JVM Command-line Options: | -server -Xmn19g -Xms21g -Xmx21g -XX:SurvivorRatio=1 -XX:TargetSurvivorRatio=99 -XX:ParallelGCThreads=28 -XX:AllocatePrefetchDistance=256 -XX:AllocatePrefetchLines=4 -XX:LoopUnrollLimit=45 -XX:InitialTenuringThreshold=12 -XX:MaxTenuringThreshold=15 -XX:InlineSmallCode=9000 -XX:MaxInlineSize=270 -XX:FreqInlineSize=6000 -XX:+UseLargePages -XX:+UseParallelOldGC -XX:+AggressiveOpts |
| JVM Affinity: | start /NODE [0,1,2,3] /AFFINITY [0xFFFFFFF] |
| JVM Instances: | 4 |
| JVM Initial Heap (MB): | 21000 |
| JVM Maximum Heap (MB): | 21000 |
| JVM Address Bits: | 64 |
| Boot Firmware Version: | I42 v1.32 (02/01/2018) |
| Management Firmware Version: | 1.15 Aug 17 2017 |
| Workload Version: | SSJ 1.2.10 |
| Director Location: | Controller |
| Other Software: | HPE Composer Version 3.10.07 (HPE OneView) with HPE Synergy Custom SPP Bundle 2017.10.20180323; Microsoft Windows KB4054519, KB4056898 |
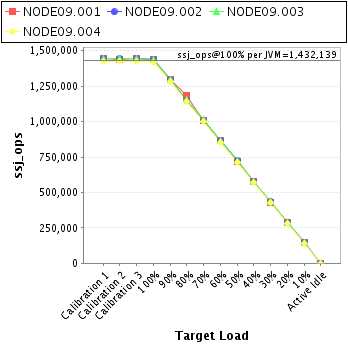
| JVM Instance | ssj_ops@100% |
|---|---|
| NODE09.001 | 1,439,004 |
| NODE09.002 | 1,436,668 |
| NODE09.003 | 1,437,878 |
| NODE09.004 | 1,415,005 |
| ssj_ops@100% | 5,728,556 |
| ssj_ops@100% per JVM | 1,432,139 |
| Target Load | Actual Load | ssj_ops | |
|---|---|---|---|
| Target | Actual | ||
| Calibration 1 | 1,445,335 | ||
| Calibration 2 | 1,441,737 | ||
| Calibration 3 | 1,444,684 | ||
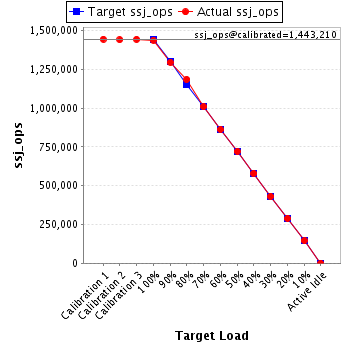
| ssj_ops@calibrated=1,443,210 | |||
| 100% | 99.7% | 1,443,210 | 1,439,004 |
| 90% | 89.8% | 1,298,889 | 1,295,749 |
| 80% | 82.2% | 1,154,568 | 1,186,130 |
| 70% | 70.0% | 1,010,247 | 1,009,872 |
| 60% | 59.8% | 865,926 | 863,549 |
| 50% | 50.0% | 721,605 | 721,915 |
| 40% | 40.1% | 577,284 | 578,827 |
| 30% | 29.9% | 432,963 | 431,730 |
| 20% | 20.1% | 288,642 | 289,597 |
| 10% | 10.1% | 144,321 | 145,599 |
| Active Idle | 0 | 0 | |
| Target Load | Actual Load | ssj_ops | |
|---|---|---|---|
| Target | Actual | ||
| Calibration 1 | 1,443,600 | ||
| Calibration 2 | 1,442,990 | ||
| Calibration 3 | 1,447,794 | ||
| ssj_ops@calibrated=1,445,392 | |||
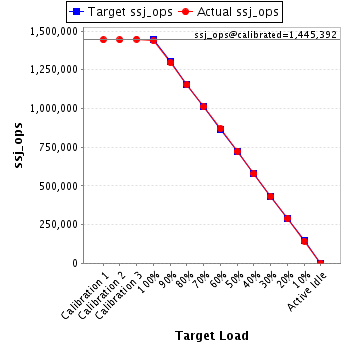
| 100% | 99.4% | 1,445,392 | 1,436,668 |
| 90% | 89.7% | 1,300,853 | 1,296,563 |
| 80% | 79.7% | 1,156,314 | 1,152,262 |
| 70% | 69.9% | 1,011,774 | 1,010,689 |
| 60% | 60.1% | 867,235 | 868,338 |
| 50% | 50.0% | 722,696 | 722,991 |
| 40% | 39.9% | 578,157 | 577,294 |
| 30% | 30.0% | 433,618 | 433,302 |
| 20% | 20.0% | 289,078 | 288,521 |
| 10% | 9.9% | 144,539 | 143,636 |
| Active Idle | 0 | 0 | |
| Target Load | Actual Load | ssj_ops | |
|---|---|---|---|
| Target | Actual | ||
| Calibration 1 | 1,444,267 | ||
| Calibration 2 | 1,446,524 | ||
| Calibration 3 | 1,445,146 | ||
| ssj_ops@calibrated=1,445,835 | |||
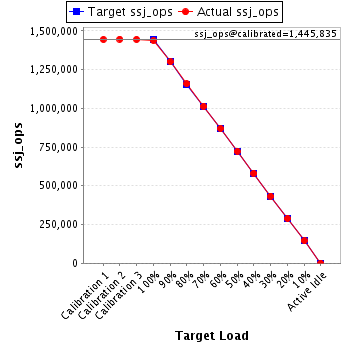
| 100% | 99.4% | 1,445,835 | 1,437,878 |
| 90% | 89.9% | 1,301,252 | 1,300,505 |
| 80% | 80.2% | 1,156,668 | 1,159,016 |
| 70% | 70.2% | 1,012,085 | 1,014,398 |
| 60% | 60.1% | 867,501 | 869,619 |
| 50% | 50.0% | 722,918 | 723,229 |
| 40% | 40.1% | 578,334 | 580,215 |
| 30% | 30.0% | 433,751 | 433,861 |
| 20% | 20.0% | 289,167 | 288,701 |
| 10% | 10.0% | 144,584 | 145,130 |
| Active Idle | 0 | 0 | |
| Target Load | Actual Load | ssj_ops | |
|---|---|---|---|
| Target | Actual | ||
| Calibration 1 | 1,427,586 | ||
| Calibration 2 | 1,423,827 | ||
| Calibration 3 | 1,426,008 | ||
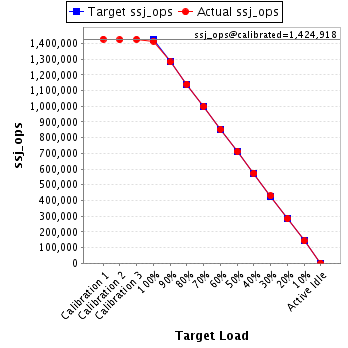
| ssj_ops@calibrated=1,424,918 | |||
| 100% | 99.3% | 1,424,918 | 1,415,005 |
| 90% | 90.0% | 1,282,426 | 1,282,280 |
| 80% | 80.0% | 1,139,934 | 1,140,323 |
| 70% | 70.1% | 997,442 | 999,378 |
| 60% | 59.9% | 854,951 | 853,245 |
| 50% | 50.0% | 712,459 | 712,070 |
| 40% | 40.2% | 569,967 | 573,196 |
| 30% | 30.1% | 427,475 | 428,489 |
| 20% | 19.9% | 284,984 | 283,648 |
| 10% | 10.0% | 142,492 | 142,464 |
| Active Idle | 0 | 0 | |