SPECpower_ssj2008
Host 'NODE08' Performance Report
Copyright © 2007-2018 Standard Performance Evaluation Corporation
| Hewlett Packard Enterprise Synergy 480 Gen10 Compute Module | ssj_ops@100% = 5,720,146 ssj_ops@100% per JVM = 1,430,036 |
||||
| Test Sponsor: | Hewlett Packard Enterprise | SPEC License #: | 3 | Test Method: | Multi Node |
| Tested By: | Hewlett Packard Enterprise | Test Location: | Houston, TX, USA | Test Date: | Aug 26, 2018 |
| Hardware Availability: | Jun-2018 | Software Availability: | Mar-2018 | Publication: | Sep 12, 2018 |
| System Source: | Single Supplier | System Designation: | Server | Power Provisioning: | Line-powered |
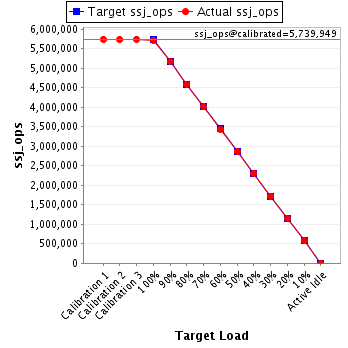
| Target Load | Actual Load | ssj_ops | |
|---|---|---|---|
| Target | Actual | ||
| Calibration 1 | 5,740,672 | ||
| Calibration 2 | 5,737,111 | ||
| Calibration 3 | 5,742,787 | ||
| ssj_ops@calibrated=5,739,949 | |||
| 100% | 99.7% | 5,739,949 | 5,720,146 |
| 90% | 90.1% | 5,165,954 | 5,171,789 |
| 80% | 79.9% | 4,591,959 | 4,588,787 |
| 70% | 70.0% | 4,017,964 | 4,015,834 |
| 60% | 59.9% | 3,443,969 | 3,436,053 |
| 50% | 50.0% | 2,869,974 | 2,870,116 |
| 40% | 40.0% | 2,295,980 | 2,298,639 |
| 30% | 30.0% | 1,721,985 | 1,723,640 |
| 20% | 20.0% | 1,147,990 | 1,149,571 |
| 10% | 10.0% | 573,995 | 572,434 |
| Active Idle | 0 | 0 | |
| Set Identifier: | SUT |
| Set Description: | System Under Test |
| # of Identical Nodes: | 11 |
| Comment: | SUT |
| Hardware | |
|---|---|
| Hardware Vendor: | Hewlett Packard Enterprise |
| Model: | Synergy 480 Gen10 Compute Module |
| Form Factor: | Other |
| CPU Name: | Intel Xeon Platinum 8180 2.50GHz |
| CPU Characteristics: | 28-Core, 2.50 GHz, 38.5 MB L3 Cache |
| CPU Frequency (MHz): | 2500 |
| CPU(s) Enabled: | 56 cores, 2 chips, 28 cores/chip |
| Hardware Threads: | 112 (2 / core) |
| CPU(s) Orderable: | 1,2 chips |
| Primary Cache: | 32 KB I + 32 KB D on chip per core |
| Secondary Cache: | 1 MB I+D on chip per core |
| Tertiary Cache: | 39424 KB I+D on chip per chip |
| Other Cache: | None |
| Memory Amount (GB): | 192 |
| # and size of DIMM: | 12 x 16384 MB |
| Memory Details: | 12 x 16GB 2Rx8 PC4-2666-V ECC; slots 1, 3, 5, 8, 10 and 12 populated on each CPU socket |
| Power Supply Quantity and Rating (W): | None |
| Power Supply Details: | Shared |
| Disk Drive: | 1 x HPE Synergy 480 Gen10 M.2 FIO Adapter Board Kit (873165-B21); 1 x HPE 480GB SATA 6G Read Intensive M.2 2280 SSD (875498-B21) |
| Disk Controller: | 1 x HPE Smart Array S100i SR Gen10 |
| # and type of Network Interface Cards (NICs) Installed: | 1 x HPE Synergy 3820C 10/20Gb 2-port Converged Network Adapter (777430-B21) |
| NICs Enabled in Firmware / OS / Connected: | 2/1/1 |
| Network Speed (Mbit): | 10000 |
| Keyboard: | None |
| Mouse: | None |
| Monitor: | None |
| Optical Drives: | No |
| Other Hardware: | None |
| Software | |
|---|---|
| Power Management: | Enabled (see SUT Notes) |
| Operating System (OS): | Windows Server 2012 R2 Datacenter |
| OS Version: | 6.3 (Build 9600) |
| Filesystem: | NTFS |
| JVM Vendor: | Oracle Corporation |
| JVM Version: | Java HotSpot(TM) 64-Bit Server VM (build 24.80-b11, mixed mode), version 1.7.0_80 |
| JVM Command-line Options: | -server -Xmn19g -Xms21g -Xmx21g -XX:SurvivorRatio=1 -XX:TargetSurvivorRatio=99 -XX:ParallelGCThreads=28 -XX:AllocatePrefetchDistance=256 -XX:AllocatePrefetchLines=4 -XX:LoopUnrollLimit=45 -XX:InitialTenuringThreshold=12 -XX:MaxTenuringThreshold=15 -XX:InlineSmallCode=9000 -XX:MaxInlineSize=270 -XX:FreqInlineSize=6000 -XX:+UseLargePages -XX:+UseParallelOldGC -XX:+AggressiveOpts |
| JVM Affinity: | start /NODE [0,1,2,3] /AFFINITY [0xFFFFFFF] |
| JVM Instances: | 4 |
| JVM Initial Heap (MB): | 21000 |
| JVM Maximum Heap (MB): | 21000 |
| JVM Address Bits: | 64 |
| Boot Firmware Version: | I42 v1.32 (02/01/2018) |
| Management Firmware Version: | 1.15 Aug 17 2017 |
| Workload Version: | SSJ 1.2.10 |
| Director Location: | Controller |
| Other Software: | HPE Composer Version 3.10.07 (HPE OneView) with HPE Synergy Custom SPP Bundle 2017.10.20180323; Microsoft Windows KB4054519, KB4056898 |
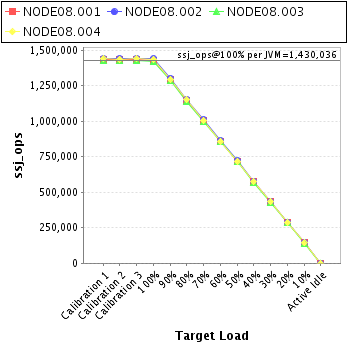
| JVM Instance | ssj_ops@100% |
|---|---|
| NODE08.001 | 1,427,348 |
| NODE08.002 | 1,438,412 |
| NODE08.003 | 1,420,600 |
| NODE08.004 | 1,433,786 |
| ssj_ops@100% | 5,720,146 |
| ssj_ops@100% per JVM | 1,430,036 |
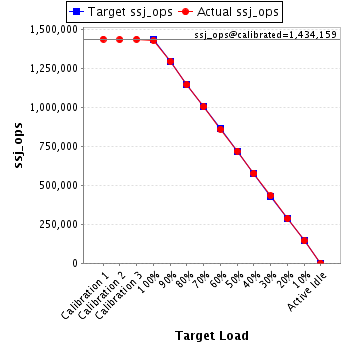
| Target Load | Actual Load | ssj_ops | |
|---|---|---|---|
| Target | Actual | ||
| Calibration 1 | 1,435,858 | ||
| Calibration 2 | 1,433,215 | ||
| Calibration 3 | 1,435,103 | ||
| ssj_ops@calibrated=1,434,159 | |||
| 100% | 99.5% | 1,434,159 | 1,427,348 |
| 90% | 90.2% | 1,290,743 | 1,293,396 |
| 80% | 79.7% | 1,147,327 | 1,143,484 |
| 70% | 69.9% | 1,003,911 | 1,003,183 |
| 60% | 59.9% | 860,495 | 859,359 |
| 50% | 50.1% | 717,079 | 718,444 |
| 40% | 40.1% | 573,663 | 575,448 |
| 30% | 30.1% | 430,248 | 432,163 |
| 20% | 20.0% | 286,832 | 286,875 |
| 10% | 10.0% | 143,416 | 144,033 |
| Active Idle | 0 | 0 | |
| Target Load | Actual Load | ssj_ops | |
|---|---|---|---|
| Target | Actual | ||
| Calibration 1 | 1,441,210 | ||
| Calibration 2 | 1,439,641 | ||
| Calibration 3 | 1,443,473 | ||
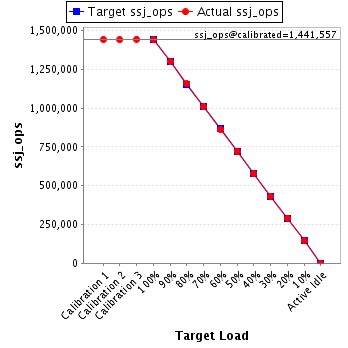
| ssj_ops@calibrated=1,441,557 | |||
| 100% | 99.8% | 1,441,557 | 1,438,412 |
| 90% | 90.2% | 1,297,401 | 1,300,045 |
| 80% | 80.2% | 1,153,246 | 1,155,670 |
| 70% | 70.0% | 1,009,090 | 1,008,945 |
| 60% | 59.7% | 864,934 | 861,163 |
| 50% | 50.0% | 720,778 | 720,599 |
| 40% | 40.0% | 576,623 | 576,885 |
| 30% | 30.0% | 432,467 | 432,221 |
| 20% | 20.1% | 288,311 | 289,279 |
| 10% | 10.0% | 144,156 | 144,207 |
| Active Idle | 0 | 0 | |
| Target Load | Actual Load | ssj_ops | |
|---|---|---|---|
| Target | Actual | ||
| Calibration 1 | 1,424,663 | ||
| Calibration 2 | 1,426,714 | ||
| Calibration 3 | 1,425,548 | ||
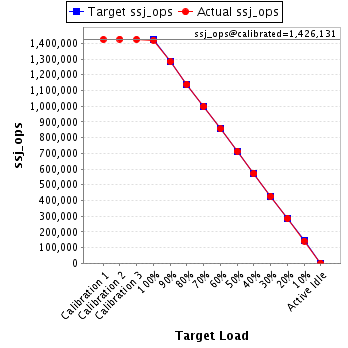
| ssj_ops@calibrated=1,426,131 | |||
| 100% | 99.6% | 1,426,131 | 1,420,600 |
| 90% | 90.0% | 1,283,518 | 1,283,670 |
| 80% | 79.8% | 1,140,905 | 1,138,666 |
| 70% | 70.0% | 998,292 | 998,550 |
| 60% | 60.0% | 855,679 | 855,670 |
| 50% | 50.0% | 713,066 | 713,481 |
| 40% | 40.0% | 570,453 | 570,488 |
| 30% | 29.9% | 427,839 | 427,032 |
| 20% | 20.0% | 285,226 | 285,196 |
| 10% | 9.9% | 142,613 | 141,460 |
| Active Idle | 0 | 0 | |
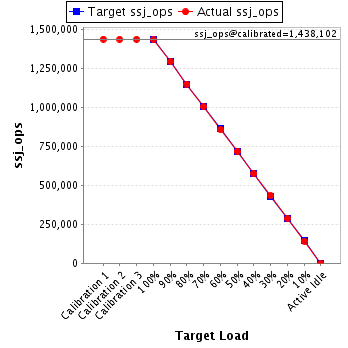
| Target Load | Actual Load | ssj_ops | |
|---|---|---|---|
| Target | Actual | ||
| Calibration 1 | 1,438,941 | ||
| Calibration 2 | 1,437,541 | ||
| Calibration 3 | 1,438,663 | ||
| ssj_ops@calibrated=1,438,102 | |||
| 100% | 99.7% | 1,438,102 | 1,433,786 |
| 90% | 90.0% | 1,294,292 | 1,294,679 |
| 80% | 80.0% | 1,150,482 | 1,150,967 |
| 70% | 69.9% | 1,006,671 | 1,005,156 |
| 60% | 59.8% | 862,861 | 859,861 |
| 50% | 49.9% | 719,051 | 717,592 |
| 40% | 40.0% | 575,241 | 575,818 |
| 30% | 30.1% | 431,431 | 432,225 |
| 20% | 20.0% | 287,620 | 288,221 |
| 10% | 9.9% | 143,810 | 142,734 |
| Active Idle | 0 | 0 | |