SPECpower_ssj2008
Host 'NODE07' Performance Report
Copyright © 2007-2018 Standard Performance Evaluation Corporation
| Hewlett Packard Enterprise Synergy 480 Gen10 Compute Module | ssj_ops@100% = 5,719,135 ssj_ops@100% per JVM = 1,429,784 |
||||
| Test Sponsor: | Hewlett Packard Enterprise | SPEC License #: | 3 | Test Method: | Multi Node |
| Tested By: | Hewlett Packard Enterprise | Test Location: | Houston, TX, USA | Test Date: | Aug 26, 2018 |
| Hardware Availability: | Jun-2018 | Software Availability: | Mar-2018 | Publication: | Sep 12, 2018 |
| System Source: | Single Supplier | System Designation: | Server | Power Provisioning: | Line-powered |
| Target Load | Actual Load | ssj_ops | |
|---|---|---|---|
| Target | Actual | ||
| Calibration 1 | 5,729,275 | ||
| Calibration 2 | 5,736,864 | ||
| Calibration 3 | 5,740,525 | ||
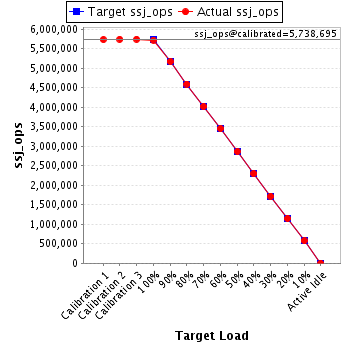
| ssj_ops@calibrated=5,738,695 | |||
| 100% | 99.7% | 5,738,695 | 5,719,135 |
| 90% | 90.0% | 5,164,825 | 5,167,405 |
| 80% | 80.0% | 4,590,956 | 4,591,303 |
| 70% | 70.0% | 4,017,086 | 4,018,350 |
| 60% | 60.1% | 3,443,217 | 3,447,784 |
| 50% | 49.9% | 2,869,347 | 2,862,808 |
| 40% | 39.9% | 2,295,478 | 2,292,567 |
| 30% | 30.0% | 1,721,608 | 1,719,876 |
| 20% | 20.0% | 1,147,739 | 1,146,774 |
| 10% | 10.0% | 573,869 | 575,609 |
| Active Idle | 0 | 0 | |
| Set Identifier: | SUT |
| Set Description: | System Under Test |
| # of Identical Nodes: | 11 |
| Comment: | SUT |
| Hardware | |
|---|---|
| Hardware Vendor: | Hewlett Packard Enterprise |
| Model: | Synergy 480 Gen10 Compute Module |
| Form Factor: | Other |
| CPU Name: | Intel Xeon Platinum 8180 2.50GHz |
| CPU Characteristics: | 28-Core, 2.50 GHz, 38.5 MB L3 Cache |
| CPU Frequency (MHz): | 2500 |
| CPU(s) Enabled: | 56 cores, 2 chips, 28 cores/chip |
| Hardware Threads: | 112 (2 / core) |
| CPU(s) Orderable: | 1,2 chips |
| Primary Cache: | 32 KB I + 32 KB D on chip per core |
| Secondary Cache: | 1 MB I+D on chip per core |
| Tertiary Cache: | 39424 KB I+D on chip per chip |
| Other Cache: | None |
| Memory Amount (GB): | 192 |
| # and size of DIMM: | 12 x 16384 MB |
| Memory Details: | 12 x 16GB 2Rx8 PC4-2666-V ECC; slots 1, 3, 5, 8, 10 and 12 populated on each CPU socket |
| Power Supply Quantity and Rating (W): | None |
| Power Supply Details: | Shared |
| Disk Drive: | 1 x HPE Synergy 480 Gen10 M.2 FIO Adapter Board Kit (873165-B21); 1 x HPE 480GB SATA 6G Read Intensive M.2 2280 SSD (875498-B21) |
| Disk Controller: | 1 x HPE Smart Array S100i SR Gen10 |
| # and type of Network Interface Cards (NICs) Installed: | 1 x HPE Synergy 3820C 10/20Gb 2-port Converged Network Adapter (777430-B21) |
| NICs Enabled in Firmware / OS / Connected: | 2/1/1 |
| Network Speed (Mbit): | 10000 |
| Keyboard: | None |
| Mouse: | None |
| Monitor: | None |
| Optical Drives: | No |
| Other Hardware: | None |
| Software | |
|---|---|
| Power Management: | Enabled (see SUT Notes) |
| Operating System (OS): | Windows Server 2012 R2 Datacenter |
| OS Version: | 6.3 (Build 9600) |
| Filesystem: | NTFS |
| JVM Vendor: | Oracle Corporation |
| JVM Version: | Java HotSpot(TM) 64-Bit Server VM (build 24.80-b11, mixed mode), version 1.7.0_80 |
| JVM Command-line Options: | -server -Xmn19g -Xms21g -Xmx21g -XX:SurvivorRatio=1 -XX:TargetSurvivorRatio=99 -XX:ParallelGCThreads=28 -XX:AllocatePrefetchDistance=256 -XX:AllocatePrefetchLines=4 -XX:LoopUnrollLimit=45 -XX:InitialTenuringThreshold=12 -XX:MaxTenuringThreshold=15 -XX:InlineSmallCode=9000 -XX:MaxInlineSize=270 -XX:FreqInlineSize=6000 -XX:+UseLargePages -XX:+UseParallelOldGC -XX:+AggressiveOpts |
| JVM Affinity: | start /NODE [0,1,2,3] /AFFINITY [0xFFFFFFF] |
| JVM Instances: | 4 |
| JVM Initial Heap (MB): | 21000 |
| JVM Maximum Heap (MB): | 21000 |
| JVM Address Bits: | 64 |
| Boot Firmware Version: | I42 v1.32 (02/01/2018) |
| Management Firmware Version: | 1.15 Aug 17 2017 |
| Workload Version: | SSJ 1.2.10 |
| Director Location: | Controller |
| Other Software: | HPE Composer Version 3.10.07 (HPE OneView) with HPE Synergy Custom SPP Bundle 2017.10.20180323; Microsoft Windows KB4054519, KB4056898 |
| JVM Instance | ssj_ops@100% |
|---|---|
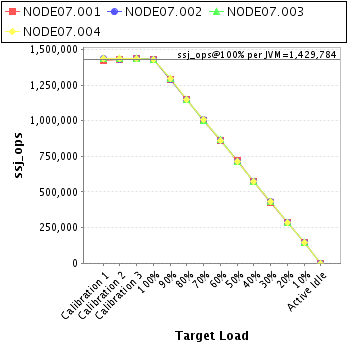
| NODE07.001 | 1,428,988 |
| NODE07.002 | 1,428,474 |
| NODE07.003 | 1,430,564 |
| NODE07.004 | 1,431,110 |
| ssj_ops@100% | 5,719,135 |
| ssj_ops@100% per JVM | 1,429,784 |
| Target Load | Actual Load | ssj_ops | |
|---|---|---|---|
| Target | Actual | ||
| Calibration 1 | 1,423,619 | ||
| Calibration 2 | 1,431,303 | ||
| Calibration 3 | 1,434,144 | ||
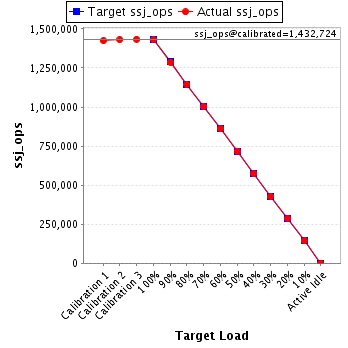
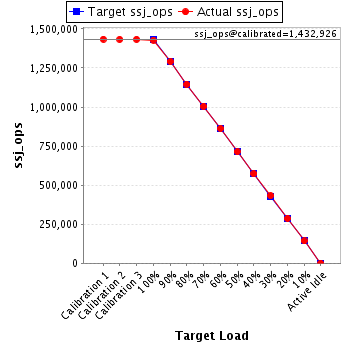
| ssj_ops@calibrated=1,432,724 | |||
| 100% | 99.7% | 1,432,724 | 1,428,988 |
| 90% | 89.8% | 1,289,451 | 1,286,956 |
| 80% | 80.0% | 1,146,179 | 1,146,751 |
| 70% | 70.1% | 1,002,907 | 1,004,118 |
| 60% | 60.0% | 859,634 | 860,066 |
| 50% | 50.1% | 716,362 | 717,583 |
| 40% | 39.9% | 573,090 | 572,037 |
| 30% | 29.8% | 429,817 | 427,082 |
| 20% | 20.0% | 286,545 | 286,116 |
| 10% | 10.0% | 143,272 | 143,225 |
| Active Idle | 0 | 0 | |
| Target Load | Actual Load | ssj_ops | |
|---|---|---|---|
| Target | Actual | ||
| Calibration 1 | 1,434,141 | ||
| Calibration 2 | 1,432,631 | ||
| Calibration 3 | 1,433,221 | ||
| ssj_ops@calibrated=1,432,926 | |||
| 100% | 99.7% | 1,432,926 | 1,428,474 |
| 90% | 90.1% | 1,289,633 | 1,291,490 |
| 80% | 79.9% | 1,146,341 | 1,145,408 |
| 70% | 70.2% | 1,003,048 | 1,005,391 |
| 60% | 60.2% | 859,756 | 862,448 |
| 50% | 49.8% | 716,463 | 713,702 |
| 40% | 39.9% | 573,170 | 572,446 |
| 30% | 30.2% | 429,878 | 432,292 |
| 20% | 20.1% | 286,585 | 287,323 |
| 10% | 9.9% | 143,293 | 142,475 |
| Active Idle | 0 | 0 | |
| Target Load | Actual Load | ssj_ops | |
|---|---|---|---|
| Target | Actual | ||
| Calibration 1 | 1,434,855 | ||
| Calibration 2 | 1,438,583 | ||
| Calibration 3 | 1,436,525 | ||
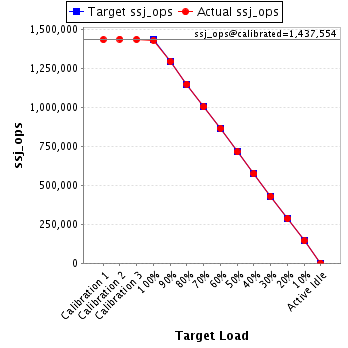
| ssj_ops@calibrated=1,437,554 | |||
| 100% | 99.5% | 1,437,554 | 1,430,564 |
| 90% | 90.1% | 1,293,799 | 1,295,548 |
| 80% | 80.0% | 1,150,043 | 1,149,516 |
| 70% | 69.8% | 1,006,288 | 1,003,696 |
| 60% | 60.2% | 862,533 | 865,653 |
| 50% | 49.7% | 718,777 | 714,743 |
| 40% | 39.9% | 575,022 | 573,594 |
| 30% | 29.9% | 431,266 | 430,294 |
| 20% | 20.0% | 287,511 | 286,831 |
| 10% | 10.0% | 143,755 | 144,389 |
| Active Idle | 0 | 0 | |
| Target Load | Actual Load | ssj_ops | |
|---|---|---|---|
| Target | Actual | ||
| Calibration 1 | 1,436,660 | ||
| Calibration 2 | 1,434,347 | ||
| Calibration 3 | 1,436,634 | ||
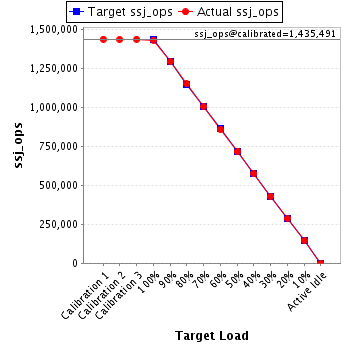
| ssj_ops@calibrated=1,435,491 | |||
| 100% | 99.7% | 1,435,491 | 1,431,110 |
| 90% | 90.1% | 1,291,942 | 1,293,412 |
| 80% | 80.1% | 1,148,393 | 1,149,628 |
| 70% | 70.0% | 1,004,843 | 1,005,145 |
| 60% | 59.9% | 861,294 | 859,618 |
| 50% | 49.9% | 717,745 | 716,780 |
| 40% | 40.0% | 574,196 | 574,490 |
| 30% | 30.0% | 430,647 | 430,208 |
| 20% | 20.0% | 287,098 | 286,504 |
| 10% | 10.1% | 143,549 | 145,520 |
| Active Idle | 0 | 0 | |