SPECpower_ssj2008
Host 'NODE04' Performance Report
Copyright © 2007-2018 Standard Performance Evaluation Corporation
| Hewlett Packard Enterprise Synergy 480 Gen10 Compute Module | ssj_ops@100% = 5,693,845 ssj_ops@100% per JVM = 1,423,461 |
||||
| Test Sponsor: | Hewlett Packard Enterprise | SPEC License #: | 3 | Test Method: | Multi Node |
| Tested By: | Hewlett Packard Enterprise | Test Location: | Houston, TX, USA | Test Date: | Aug 26, 2018 |
| Hardware Availability: | Jun-2018 | Software Availability: | Mar-2018 | Publication: | Sep 12, 2018 |
| System Source: | Single Supplier | System Designation: | Server | Power Provisioning: | Line-powered |
| Target Load | Actual Load | ssj_ops | |
|---|---|---|---|
| Target | Actual | ||
| Calibration 1 | 5,730,161 | ||
| Calibration 2 | 5,718,088 | ||
| Calibration 3 | 5,726,396 | ||
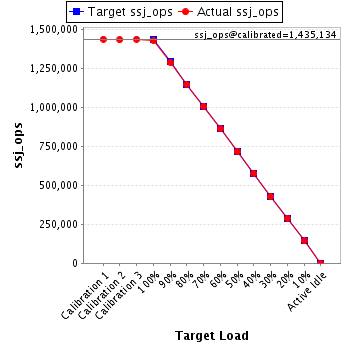
| ssj_ops@calibrated=5,722,242 | |||
| 100% | 99.5% | 5,722,242 | 5,693,845 |
| 90% | 89.9% | 5,150,017 | 5,144,588 |
| 80% | 79.9% | 4,577,793 | 4,574,348 |
| 70% | 69.9% | 4,005,569 | 4,000,836 |
| 60% | 60.0% | 3,433,345 | 3,435,253 |
| 50% | 49.9% | 2,861,121 | 2,855,373 |
| 40% | 40.1% | 2,288,897 | 2,294,091 |
| 30% | 30.0% | 1,716,672 | 1,715,428 |
| 20% | 20.0% | 1,144,448 | 1,144,669 |
| 10% | 10.0% | 572,224 | 573,085 |
| Active Idle | 0 | 0 | |
| Set Identifier: | SUT |
| Set Description: | System Under Test |
| # of Identical Nodes: | 11 |
| Comment: | SUT |
| Hardware | |
|---|---|
| Hardware Vendor: | Hewlett Packard Enterprise |
| Model: | Synergy 480 Gen10 Compute Module |
| Form Factor: | Other |
| CPU Name: | Intel Xeon Platinum 8180 2.50GHz |
| CPU Characteristics: | 28-Core, 2.50 GHz, 38.5 MB L3 Cache |
| CPU Frequency (MHz): | 2500 |
| CPU(s) Enabled: | 56 cores, 2 chips, 28 cores/chip |
| Hardware Threads: | 112 (2 / core) |
| CPU(s) Orderable: | 1,2 chips |
| Primary Cache: | 32 KB I + 32 KB D on chip per core |
| Secondary Cache: | 1 MB I+D on chip per core |
| Tertiary Cache: | 39424 KB I+D on chip per chip |
| Other Cache: | None |
| Memory Amount (GB): | 192 |
| # and size of DIMM: | 12 x 16384 MB |
| Memory Details: | 12 x 16GB 2Rx8 PC4-2666-V ECC; slots 1, 3, 5, 8, 10 and 12 populated on each CPU socket |
| Power Supply Quantity and Rating (W): | None |
| Power Supply Details: | Shared |
| Disk Drive: | 1 x HPE Synergy 480 Gen10 M.2 FIO Adapter Board Kit (873165-B21); 1 x HPE 480GB SATA 6G Read Intensive M.2 2280 SSD (875498-B21) |
| Disk Controller: | 1 x HPE Smart Array S100i SR Gen10 |
| # and type of Network Interface Cards (NICs) Installed: | 1 x HPE Synergy 3820C 10/20Gb 2-port Converged Network Adapter (777430-B21) |
| NICs Enabled in Firmware / OS / Connected: | 2/1/1 |
| Network Speed (Mbit): | 10000 |
| Keyboard: | None |
| Mouse: | None |
| Monitor: | None |
| Optical Drives: | No |
| Other Hardware: | None |
| Software | |
|---|---|
| Power Management: | Enabled (see SUT Notes) |
| Operating System (OS): | Windows Server 2012 R2 Datacenter |
| OS Version: | 6.3 (Build 9600) |
| Filesystem: | NTFS |
| JVM Vendor: | Oracle Corporation |
| JVM Version: | Java HotSpot(TM) 64-Bit Server VM (build 24.80-b11, mixed mode), version 1.7.0_80 |
| JVM Command-line Options: | -server -Xmn19g -Xms21g -Xmx21g -XX:SurvivorRatio=1 -XX:TargetSurvivorRatio=99 -XX:ParallelGCThreads=28 -XX:AllocatePrefetchDistance=256 -XX:AllocatePrefetchLines=4 -XX:LoopUnrollLimit=45 -XX:InitialTenuringThreshold=12 -XX:MaxTenuringThreshold=15 -XX:InlineSmallCode=9000 -XX:MaxInlineSize=270 -XX:FreqInlineSize=6000 -XX:+UseLargePages -XX:+UseParallelOldGC -XX:+AggressiveOpts |
| JVM Affinity: | start /NODE [0,1,2,3] /AFFINITY [0xFFFFFFF] |
| JVM Instances: | 4 |
| JVM Initial Heap (MB): | 21000 |
| JVM Maximum Heap (MB): | 21000 |
| JVM Address Bits: | 64 |
| Boot Firmware Version: | I42 v1.32 (02/01/2018) |
| Management Firmware Version: | 1.15 Aug 17 2017 |
| Workload Version: | SSJ 1.2.10 |
| Director Location: | Controller |
| Other Software: | HPE Composer Version 3.10.07 (HPE OneView) with HPE Synergy Custom SPP Bundle 2017.10.20180323; Microsoft Windows KB4054519, KB4056898 |
| JVM Instance | ssj_ops@100% |
|---|---|
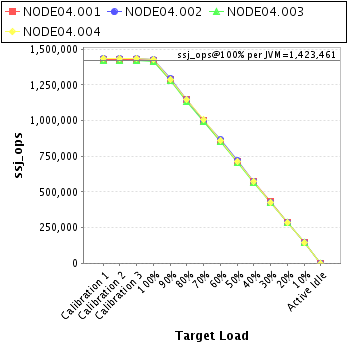
| NODE04.001 | 1,421,252 |
| NODE04.002 | 1,429,655 |
| NODE04.003 | 1,414,599 |
| NODE04.004 | 1,428,339 |
| ssj_ops@100% | 5,693,845 |
| ssj_ops@100% per JVM | 1,423,461 |
| Target Load | Actual Load | ssj_ops | |
|---|---|---|---|
| Target | Actual | ||
| Calibration 1 | 1,432,012 | ||
| Calibration 2 | 1,428,763 | ||
| Calibration 3 | 1,430,091 | ||
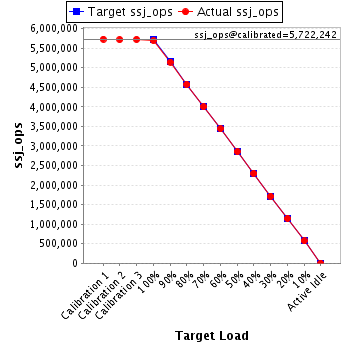
| ssj_ops@calibrated=1,429,427 | |||
| 100% | 99.4% | 1,429,427 | 1,421,252 |
| 90% | 89.9% | 1,286,484 | 1,284,843 |
| 80% | 80.1% | 1,143,542 | 1,145,078 |
| 70% | 69.9% | 1,000,599 | 999,165 |
| 60% | 59.9% | 857,656 | 856,641 |
| 50% | 50.0% | 714,714 | 714,018 |
| 40% | 40.1% | 571,771 | 573,303 |
| 30% | 30.2% | 428,828 | 432,294 |
| 20% | 20.0% | 285,885 | 285,552 |
| 10% | 10.0% | 142,943 | 143,054 |
| Active Idle | 0 | 0 | |
| Target Load | Actual Load | ssj_ops | |
|---|---|---|---|
| Target | Actual | ||
| Calibration 1 | 1,437,823 | ||
| Calibration 2 | 1,436,277 | ||
| Calibration 3 | 1,435,051 | ||
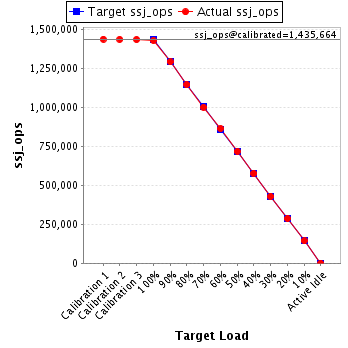
| ssj_ops@calibrated=1,435,664 | |||
| 100% | 99.6% | 1,435,664 | 1,429,655 |
| 90% | 90.0% | 1,292,098 | 1,292,482 |
| 80% | 79.9% | 1,148,531 | 1,146,539 |
| 70% | 69.8% | 1,004,965 | 1,001,966 |
| 60% | 60.2% | 861,399 | 864,415 |
| 50% | 50.0% | 717,832 | 718,264 |
| 40% | 40.1% | 574,266 | 576,245 |
| 30% | 29.9% | 430,699 | 429,318 |
| 20% | 19.9% | 287,133 | 286,398 |
| 10% | 10.0% | 143,566 | 144,030 |
| Active Idle | 0 | 0 | |
| Target Load | Actual Load | ssj_ops | |
|---|---|---|---|
| Target | Actual | ||
| Calibration 1 | 1,424,263 | ||
| Calibration 2 | 1,419,700 | ||
| Calibration 3 | 1,424,332 | ||
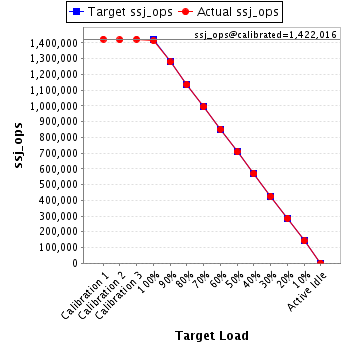
| ssj_ops@calibrated=1,422,016 | |||
| 100% | 99.5% | 1,422,016 | 1,414,599 |
| 90% | 90.0% | 1,279,814 | 1,279,606 |
| 80% | 79.8% | 1,137,613 | 1,135,460 |
| 70% | 69.9% | 995,411 | 994,286 |
| 60% | 60.0% | 853,210 | 852,792 |
| 50% | 49.8% | 711,008 | 707,768 |
| 40% | 40.0% | 568,806 | 568,553 |
| 30% | 29.9% | 426,605 | 425,609 |
| 20% | 20.1% | 284,403 | 285,696 |
| 10% | 10.0% | 142,202 | 142,343 |
| Active Idle | 0 | 0 | |
| Target Load | Actual Load | ssj_ops | |
|---|---|---|---|
| Target | Actual | ||
| Calibration 1 | 1,436,063 | ||
| Calibration 2 | 1,433,347 | ||
| Calibration 3 | 1,436,921 | ||
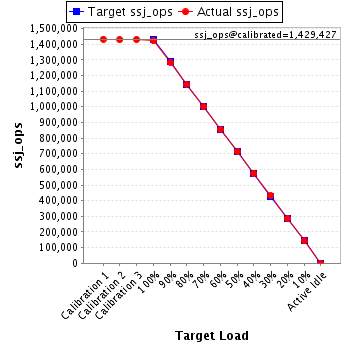
| ssj_ops@calibrated=1,435,134 | |||
| 100% | 99.5% | 1,435,134 | 1,428,339 |
| 90% | 89.7% | 1,291,621 | 1,287,658 |
| 80% | 79.9% | 1,148,107 | 1,147,272 |
| 70% | 70.1% | 1,004,594 | 1,005,419 |
| 60% | 60.0% | 861,080 | 861,406 |
| 50% | 49.8% | 717,567 | 715,324 |
| 40% | 40.1% | 574,054 | 575,991 |
| 30% | 29.8% | 430,540 | 428,206 |
| 20% | 20.0% | 287,027 | 287,023 |
| 10% | 10.0% | 143,513 | 143,658 |
| Active Idle | 0 | 0 | |