SPECpower_ssj2008
Host 'NODE03' Performance Report
Copyright © 2007-2018 Standard Performance Evaluation Corporation
| Hewlett Packard Enterprise Synergy 480 Gen10 Compute Module | ssj_ops@100% = 5,748,027 ssj_ops@100% per JVM = 1,437,007 |
||||
| Test Sponsor: | Hewlett Packard Enterprise | SPEC License #: | 3 | Test Method: | Multi Node |
| Tested By: | Hewlett Packard Enterprise | Test Location: | Houston, TX, USA | Test Date: | Aug 26, 2018 |
| Hardware Availability: | Jun-2018 | Software Availability: | Mar-2018 | Publication: | Sep 12, 2018 |
| System Source: | Single Supplier | System Designation: | Server | Power Provisioning: | Line-powered |
| Target Load | Actual Load | ssj_ops | |
|---|---|---|---|
| Target | Actual | ||
| Calibration 1 | 5,771,383 | ||
| Calibration 2 | 5,763,082 | ||
| Calibration 3 | 5,773,467 | ||
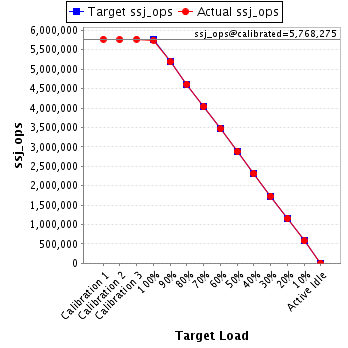
| ssj_ops@calibrated=5,768,275 | |||
| 100% | 99.6% | 5,768,275 | 5,748,027 |
| 90% | 90.0% | 5,191,447 | 5,189,782 |
| 80% | 79.9% | 4,614,620 | 4,610,561 |
| 70% | 70.0% | 4,037,792 | 4,036,481 |
| 60% | 60.0% | 3,460,965 | 3,459,777 |
| 50% | 50.0% | 2,884,137 | 2,883,737 |
| 40% | 40.0% | 2,307,310 | 2,307,384 |
| 30% | 30.0% | 1,730,482 | 1,731,949 |
| 20% | 20.0% | 1,153,655 | 1,151,740 |
| 10% | 10.0% | 576,827 | 575,780 |
| Active Idle | 0 | 0 | |
| Set Identifier: | SUT |
| Set Description: | System Under Test |
| # of Identical Nodes: | 11 |
| Comment: | SUT |
| Hardware | |
|---|---|
| Hardware Vendor: | Hewlett Packard Enterprise |
| Model: | Synergy 480 Gen10 Compute Module |
| Form Factor: | Other |
| CPU Name: | Intel Xeon Platinum 8180 2.50GHz |
| CPU Characteristics: | 28-Core, 2.50 GHz, 38.5 MB L3 Cache |
| CPU Frequency (MHz): | 2500 |
| CPU(s) Enabled: | 56 cores, 2 chips, 28 cores/chip |
| Hardware Threads: | 112 (2 / core) |
| CPU(s) Orderable: | 1,2 chips |
| Primary Cache: | 32 KB I + 32 KB D on chip per core |
| Secondary Cache: | 1 MB I+D on chip per core |
| Tertiary Cache: | 39424 KB I+D on chip per chip |
| Other Cache: | None |
| Memory Amount (GB): | 192 |
| # and size of DIMM: | 12 x 16384 MB |
| Memory Details: | 12 x 16GB 2Rx8 PC4-2666-V ECC; slots 1, 3, 5, 8, 10 and 12 populated on each CPU socket |
| Power Supply Quantity and Rating (W): | None |
| Power Supply Details: | Shared |
| Disk Drive: | 1 x HPE Synergy 480 Gen10 M.2 FIO Adapter Board Kit (873165-B21); 1 x HPE 480GB SATA 6G Read Intensive M.2 2280 SSD (875498-B21) |
| Disk Controller: | 1 x HPE Smart Array S100i SR Gen10 |
| # and type of Network Interface Cards (NICs) Installed: | 1 x HPE Synergy 3820C 10/20Gb 2-port Converged Network Adapter (777430-B21) |
| NICs Enabled in Firmware / OS / Connected: | 2/1/1 |
| Network Speed (Mbit): | 10000 |
| Keyboard: | None |
| Mouse: | None |
| Monitor: | None |
| Optical Drives: | No |
| Other Hardware: | None |
| Software | |
|---|---|
| Power Management: | Enabled (see SUT Notes) |
| Operating System (OS): | Windows Server 2012 R2 Datacenter |
| OS Version: | 6.3 (Build 9600) |
| Filesystem: | NTFS |
| JVM Vendor: | Oracle Corporation |
| JVM Version: | Java HotSpot(TM) 64-Bit Server VM (build 24.80-b11, mixed mode), version 1.7.0_80 |
| JVM Command-line Options: | -server -Xmn19g -Xms21g -Xmx21g -XX:SurvivorRatio=1 -XX:TargetSurvivorRatio=99 -XX:ParallelGCThreads=28 -XX:AllocatePrefetchDistance=256 -XX:AllocatePrefetchLines=4 -XX:LoopUnrollLimit=45 -XX:InitialTenuringThreshold=12 -XX:MaxTenuringThreshold=15 -XX:InlineSmallCode=9000 -XX:MaxInlineSize=270 -XX:FreqInlineSize=6000 -XX:+UseLargePages -XX:+UseParallelOldGC -XX:+AggressiveOpts |
| JVM Affinity: | start /NODE [0,1,2,3] /AFFINITY [0xFFFFFFF] |
| JVM Instances: | 4 |
| JVM Initial Heap (MB): | 21000 |
| JVM Maximum Heap (MB): | 21000 |
| JVM Address Bits: | 64 |
| Boot Firmware Version: | I42 v1.32 (02/01/2018) |
| Management Firmware Version: | 1.15 Aug 17 2017 |
| Workload Version: | SSJ 1.2.10 |
| Director Location: | Controller |
| Other Software: | HPE Composer Version 3.10.07 (HPE OneView) with HPE Synergy Custom SPP Bundle 2017.10.20180323; Microsoft Windows KB4054519, KB4056898 |
| JVM Instance | ssj_ops@100% |
|---|---|
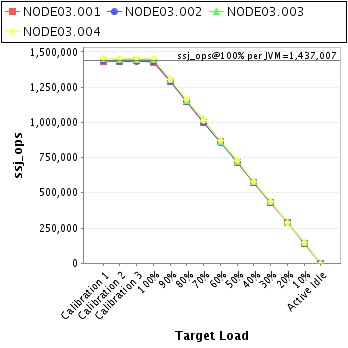
| NODE03.001 | 1,425,258 |
| NODE03.002 | 1,429,245 |
| NODE03.003 | 1,442,385 |
| NODE03.004 | 1,451,139 |
| ssj_ops@100% | 5,748,027 |
| ssj_ops@100% per JVM | 1,437,007 |
| Target Load | Actual Load | ssj_ops | |
|---|---|---|---|
| Target | Actual | ||
| Calibration 1 | 1,432,405 | ||
| Calibration 2 | 1,431,244 | ||
| Calibration 3 | 1,435,117 | ||
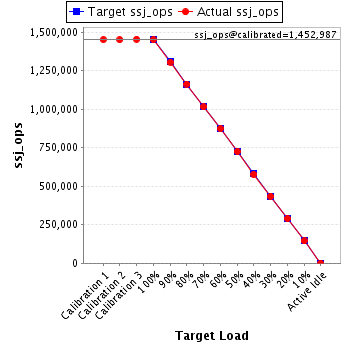
| ssj_ops@calibrated=1,433,180 | |||
| 100% | 99.4% | 1,433,180 | 1,425,258 |
| 90% | 90.1% | 1,289,862 | 1,291,365 |
| 80% | 79.9% | 1,146,544 | 1,145,358 |
| 70% | 69.9% | 1,003,226 | 1,001,105 |
| 60% | 60.1% | 859,908 | 861,670 |
| 50% | 50.1% | 716,590 | 717,714 |
| 40% | 40.1% | 573,272 | 574,093 |
| 30% | 30.1% | 429,954 | 430,781 |
| 20% | 19.9% | 286,636 | 285,833 |
| 10% | 10.0% | 143,318 | 143,734 |
| Active Idle | 0 | 0 | |
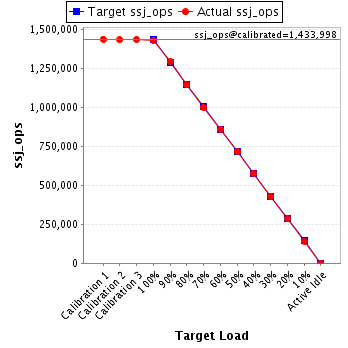
| Target Load | Actual Load | ssj_ops | |
|---|---|---|---|
| Target | Actual | ||
| Calibration 1 | 1,437,913 | ||
| Calibration 2 | 1,433,348 | ||
| Calibration 3 | 1,434,648 | ||
| ssj_ops@calibrated=1,433,998 | |||
| 100% | 99.7% | 1,433,998 | 1,429,245 |
| 90% | 90.1% | 1,290,598 | 1,292,098 |
| 80% | 79.9% | 1,147,198 | 1,145,528 |
| 70% | 69.9% | 1,003,799 | 1,002,211 |
| 60% | 60.0% | 860,399 | 860,111 |
| 50% | 50.0% | 716,999 | 717,634 |
| 40% | 40.1% | 573,599 | 574,641 |
| 30% | 30.0% | 430,199 | 429,870 |
| 20% | 19.9% | 286,800 | 285,663 |
| 10% | 9.9% | 143,400 | 142,318 |
| Active Idle | 0 | 0 | |
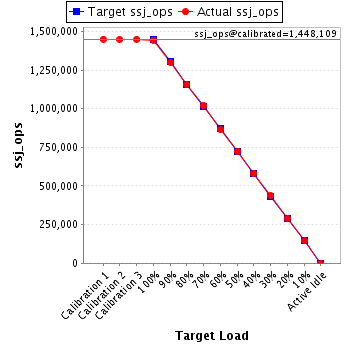
| Target Load | Actual Load | ssj_ops | |
|---|---|---|---|
| Target | Actual | ||
| Calibration 1 | 1,449,611 | ||
| Calibration 2 | 1,447,558 | ||
| Calibration 3 | 1,448,661 | ||
| ssj_ops@calibrated=1,448,109 | |||
| 100% | 99.6% | 1,448,109 | 1,442,385 |
| 90% | 89.8% | 1,303,298 | 1,300,402 |
| 80% | 79.8% | 1,158,487 | 1,155,979 |
| 70% | 70.3% | 1,013,677 | 1,018,192 |
| 60% | 59.8% | 868,866 | 865,548 |
| 50% | 49.9% | 724,055 | 722,733 |
| 40% | 40.1% | 579,244 | 580,397 |
| 30% | 30.1% | 434,433 | 435,900 |
| 20% | 20.0% | 289,622 | 289,805 |
| 10% | 10.0% | 144,811 | 145,059 |
| Active Idle | 0 | 0 | |
| Target Load | Actual Load | ssj_ops | |
|---|---|---|---|
| Target | Actual | ||
| Calibration 1 | 1,451,453 | ||
| Calibration 2 | 1,450,933 | ||
| Calibration 3 | 1,455,041 | ||
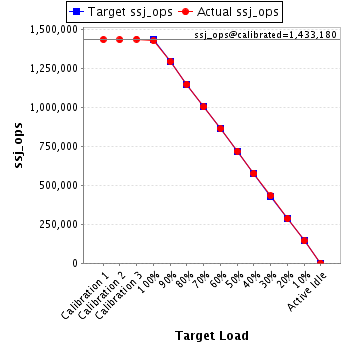
| ssj_ops@calibrated=1,452,987 | |||
| 100% | 99.9% | 1,452,987 | 1,451,139 |
| 90% | 89.9% | 1,307,688 | 1,305,916 |
| 80% | 80.1% | 1,162,389 | 1,163,696 |
| 70% | 69.9% | 1,017,091 | 1,014,973 |
| 60% | 60.0% | 871,792 | 872,448 |
| 50% | 49.9% | 726,493 | 725,656 |
| 40% | 39.8% | 581,195 | 578,254 |
| 30% | 30.0% | 435,896 | 435,398 |
| 20% | 20.0% | 290,597 | 290,439 |
| 10% | 10.0% | 145,299 | 144,670 |
| Active Idle | 0 | 0 | |