SPECpower_ssj2008
Host 'NODE02' Performance Report
Copyright © 2007-2018 Standard Performance Evaluation Corporation
| Hewlett Packard Enterprise Synergy 480 Gen10 Compute Module | ssj_ops@100% = 5,728,531 ssj_ops@100% per JVM = 1,432,133 |
||||
| Test Sponsor: | Hewlett Packard Enterprise | SPEC License #: | 3 | Test Method: | Multi Node |
| Tested By: | Hewlett Packard Enterprise | Test Location: | Houston, TX, USA | Test Date: | Aug 26, 2018 |
| Hardware Availability: | Jun-2018 | Software Availability: | Mar-2018 | Publication: | Sep 12, 2018 |
| System Source: | Single Supplier | System Designation: | Server | Power Provisioning: | Line-powered |
| Target Load | Actual Load | ssj_ops | |
|---|---|---|---|
| Target | Actual | ||
| Calibration 1 | 5,760,674 | ||
| Calibration 2 | 5,753,998 | ||
| Calibration 3 | 5,759,425 | ||
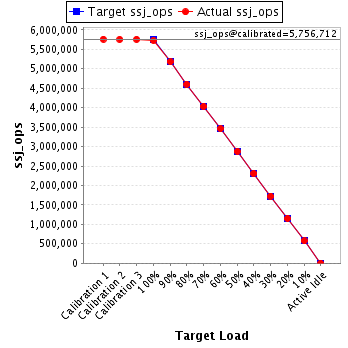
| ssj_ops@calibrated=5,756,712 | |||
| 100% | 99.5% | 5,756,712 | 5,728,531 |
| 90% | 90.0% | 5,181,041 | 5,180,344 |
| 80% | 79.9% | 4,605,370 | 4,601,648 |
| 70% | 70.1% | 4,029,698 | 4,035,366 |
| 60% | 60.1% | 3,454,027 | 3,458,526 |
| 50% | 50.0% | 2,878,356 | 2,875,624 |
| 40% | 40.1% | 2,302,685 | 2,305,717 |
| 30% | 30.0% | 1,727,014 | 1,727,589 |
| 20% | 20.0% | 1,151,342 | 1,150,405 |
| 10% | 10.0% | 575,671 | 575,507 |
| Active Idle | 0 | 0 | |
| Set Identifier: | SUT |
| Set Description: | System Under Test |
| # of Identical Nodes: | 11 |
| Comment: | SUT |
| Hardware | |
|---|---|
| Hardware Vendor: | Hewlett Packard Enterprise |
| Model: | Synergy 480 Gen10 Compute Module |
| Form Factor: | Other |
| CPU Name: | Intel Xeon Platinum 8180 2.50GHz |
| CPU Characteristics: | 28-Core, 2.50 GHz, 38.5 MB L3 Cache |
| CPU Frequency (MHz): | 2500 |
| CPU(s) Enabled: | 56 cores, 2 chips, 28 cores/chip |
| Hardware Threads: | 112 (2 / core) |
| CPU(s) Orderable: | 1,2 chips |
| Primary Cache: | 32 KB I + 32 KB D on chip per core |
| Secondary Cache: | 1 MB I+D on chip per core |
| Tertiary Cache: | 39424 KB I+D on chip per chip |
| Other Cache: | None |
| Memory Amount (GB): | 192 |
| # and size of DIMM: | 12 x 16384 MB |
| Memory Details: | 12 x 16GB 2Rx8 PC4-2666-V ECC; slots 1, 3, 5, 8, 10 and 12 populated on each CPU socket |
| Power Supply Quantity and Rating (W): | None |
| Power Supply Details: | Shared |
| Disk Drive: | 1 x HPE Synergy 480 Gen10 M.2 FIO Adapter Board Kit (873165-B21); 1 x HPE 480GB SATA 6G Read Intensive M.2 2280 SSD (875498-B21) |
| Disk Controller: | 1 x HPE Smart Array S100i SR Gen10 |
| # and type of Network Interface Cards (NICs) Installed: | 1 x HPE Synergy 3820C 10/20Gb 2-port Converged Network Adapter (777430-B21) |
| NICs Enabled in Firmware / OS / Connected: | 2/1/1 |
| Network Speed (Mbit): | 10000 |
| Keyboard: | None |
| Mouse: | None |
| Monitor: | None |
| Optical Drives: | No |
| Other Hardware: | None |
| Software | |
|---|---|
| Power Management: | Enabled (see SUT Notes) |
| Operating System (OS): | Windows Server 2012 R2 Datacenter |
| OS Version: | 6.3 (Build 9600) |
| Filesystem: | NTFS |
| JVM Vendor: | Oracle Corporation |
| JVM Version: | Java HotSpot(TM) 64-Bit Server VM (build 24.80-b11, mixed mode), version 1.7.0_80 |
| JVM Command-line Options: | -server -Xmn19g -Xms21g -Xmx21g -XX:SurvivorRatio=1 -XX:TargetSurvivorRatio=99 -XX:ParallelGCThreads=28 -XX:AllocatePrefetchDistance=256 -XX:AllocatePrefetchLines=4 -XX:LoopUnrollLimit=45 -XX:InitialTenuringThreshold=12 -XX:MaxTenuringThreshold=15 -XX:InlineSmallCode=9000 -XX:MaxInlineSize=270 -XX:FreqInlineSize=6000 -XX:+UseLargePages -XX:+UseParallelOldGC -XX:+AggressiveOpts |
| JVM Affinity: | start /NODE [0,1,2,3] /AFFINITY [0xFFFFFFF] |
| JVM Instances: | 4 |
| JVM Initial Heap (MB): | 21000 |
| JVM Maximum Heap (MB): | 21000 |
| JVM Address Bits: | 64 |
| Boot Firmware Version: | I42 v1.32 (02/01/2018) |
| Management Firmware Version: | 1.15 Aug 17 2017 |
| Workload Version: | SSJ 1.2.10 |
| Director Location: | Controller |
| Other Software: | HPE Composer Version 3.10.07 (HPE OneView) with HPE Synergy Custom SPP Bundle 2017.10.20180323; Microsoft Windows KB4054519, KB4056898 |
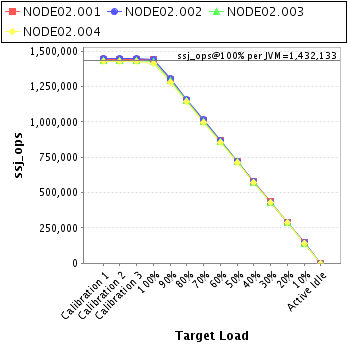
| JVM Instance | ssj_ops@100% |
|---|---|
| NODE02.001 | 1,439,743 |
| NODE02.002 | 1,442,967 |
| NODE02.003 | 1,428,573 |
| NODE02.004 | 1,417,248 |
| ssj_ops@100% | 5,728,531 |
| ssj_ops@100% per JVM | 1,432,133 |
| Target Load | Actual Load | ssj_ops | |
|---|---|---|---|
| Target | Actual | ||
| Calibration 1 | 1,445,230 | ||
| Calibration 2 | 1,443,555 | ||
| Calibration 3 | 1,444,516 | ||
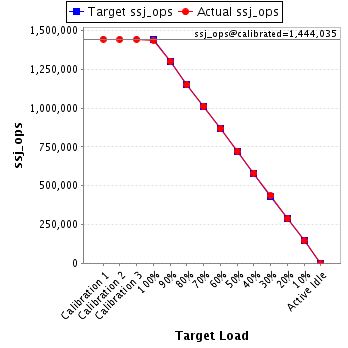
| ssj_ops@calibrated=1,444,035 | |||
| 100% | 99.7% | 1,444,035 | 1,439,743 |
| 90% | 90.3% | 1,299,632 | 1,303,772 |
| 80% | 79.7% | 1,155,228 | 1,151,319 |
| 70% | 70.2% | 1,010,825 | 1,013,708 |
| 60% | 60.1% | 866,421 | 868,097 |
| 50% | 50.1% | 722,018 | 723,431 |
| 40% | 40.3% | 577,614 | 581,638 |
| 30% | 30.1% | 433,211 | 434,072 |
| 20% | 19.9% | 288,807 | 286,931 |
| 10% | 10.0% | 144,404 | 144,924 |
| Active Idle | 0 | 0 | |
| Target Load | Actual Load | ssj_ops | |
|---|---|---|---|
| Target | Actual | ||
| Calibration 1 | 1,451,701 | ||
| Calibration 2 | 1,449,219 | ||
| Calibration 3 | 1,449,203 | ||
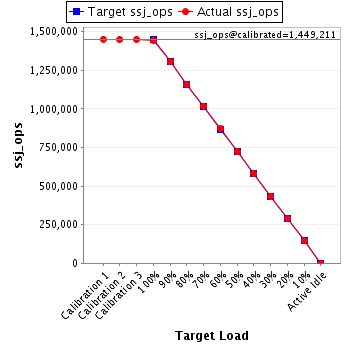
| ssj_ops@calibrated=1,449,211 | |||
| 100% | 99.6% | 1,449,211 | 1,442,967 |
| 90% | 90.0% | 1,304,290 | 1,304,765 |
| 80% | 80.0% | 1,159,369 | 1,159,071 |
| 70% | 70.2% | 1,014,448 | 1,016,779 |
| 60% | 60.1% | 869,527 | 870,775 |
| 50% | 49.9% | 724,605 | 722,710 |
| 40% | 40.0% | 579,684 | 579,180 |
| 30% | 29.9% | 434,763 | 433,485 |
| 20% | 19.9% | 289,842 | 288,314 |
| 10% | 10.0% | 144,921 | 144,496 |
| Active Idle | 0 | 0 | |
| Target Load | Actual Load | ssj_ops | |
|---|---|---|---|
| Target | Actual | ||
| Calibration 1 | 1,435,611 | ||
| Calibration 2 | 1,434,112 | ||
| Calibration 3 | 1,435,631 | ||
| ssj_ops@calibrated=1,434,871 | |||
| 100% | 99.6% | 1,434,871 | 1,428,573 |
| 90% | 90.0% | 1,291,384 | 1,291,094 |
| 80% | 80.1% | 1,147,897 | 1,148,616 |
| 70% | 70.1% | 1,004,410 | 1,006,096 |
| 60% | 60.0% | 860,923 | 861,480 |
| 50% | 50.0% | 717,436 | 717,862 |
| 40% | 40.1% | 573,949 | 574,964 |
| 30% | 30.1% | 430,461 | 431,345 |
| 20% | 20.2% | 286,974 | 289,183 |
| 10% | 9.9% | 143,487 | 142,681 |
| Active Idle | 0 | 0 | |

| Target Load | Actual Load | ssj_ops | |
|---|---|---|---|
| Target | Actual | ||
| Calibration 1 | 1,428,131 | ||
| Calibration 2 | 1,427,114 | ||
| Calibration 3 | 1,430,075 | ||
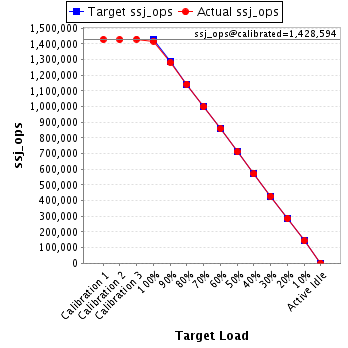
| ssj_ops@calibrated=1,428,594 | |||
| 100% | 99.2% | 1,428,594 | 1,417,248 |
| 90% | 89.6% | 1,285,735 | 1,280,713 |
| 80% | 80.0% | 1,142,876 | 1,142,642 |
| 70% | 69.9% | 1,000,016 | 998,783 |
| 60% | 60.1% | 857,157 | 858,174 |
| 50% | 49.8% | 714,297 | 711,621 |
| 40% | 39.9% | 571,438 | 569,934 |
| 30% | 30.0% | 428,578 | 428,687 |
| 20% | 20.0% | 285,719 | 285,978 |
| 10% | 10.0% | 142,859 | 143,406 |
| Active Idle | 0 | 0 | |