SPECpower_ssj2008
Host 'NODE01' Performance Report
Copyright © 2007-2018 Standard Performance Evaluation Corporation
| Hewlett Packard Enterprise Synergy 480 Gen10 Compute Module | ssj_ops@100% = 5,752,388 ssj_ops@100% per JVM = 1,438,097 |
||||
| Test Sponsor: | Hewlett Packard Enterprise | SPEC License #: | 3 | Test Method: | Multi Node |
| Tested By: | Hewlett Packard Enterprise | Test Location: | Houston, TX, USA | Test Date: | Aug 26, 2018 |
| Hardware Availability: | Jun-2018 | Software Availability: | Mar-2018 | Publication: | Sep 12, 2018 |
| System Source: | Single Supplier | System Designation: | Server | Power Provisioning: | Line-powered |
| Target Load | Actual Load | ssj_ops | |
|---|---|---|---|
| Target | Actual | ||
| Calibration 1 | 5,777,716 | ||
| Calibration 2 | 5,776,219 | ||
| Calibration 3 | 5,786,479 | ||
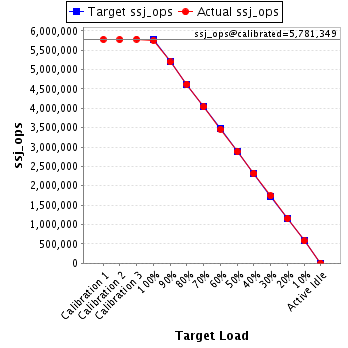
| ssj_ops@calibrated=5,781,349 | |||
| 100% | 99.5% | 5,781,349 | 5,752,388 |
| 90% | 89.9% | 5,203,214 | 5,197,137 |
| 80% | 79.9% | 4,625,079 | 4,620,918 |
| 70% | 69.9% | 4,046,944 | 4,038,945 |
| 60% | 59.9% | 3,468,809 | 3,462,692 |
| 50% | 49.9% | 2,890,674 | 2,882,486 |
| 40% | 40.1% | 2,312,540 | 2,317,805 |
| 30% | 30.1% | 1,734,405 | 1,737,370 |
| 20% | 20.0% | 1,156,270 | 1,156,319 |
| 10% | 10.0% | 578,135 | 577,705 |
| Active Idle | 0 | 0 | |
| Set Identifier: | SUT |
| Set Description: | System Under Test |
| # of Identical Nodes: | 11 |
| Comment: | SUT |
| Hardware | |
|---|---|
| Hardware Vendor: | Hewlett Packard Enterprise |
| Model: | Synergy 480 Gen10 Compute Module |
| Form Factor: | Other |
| CPU Name: | Intel Xeon Platinum 8180 2.50GHz |
| CPU Characteristics: | 28-Core, 2.50 GHz, 38.5 MB L3 Cache |
| CPU Frequency (MHz): | 2500 |
| CPU(s) Enabled: | 56 cores, 2 chips, 28 cores/chip |
| Hardware Threads: | 112 (2 / core) |
| CPU(s) Orderable: | 1,2 chips |
| Primary Cache: | 32 KB I + 32 KB D on chip per core |
| Secondary Cache: | 1 MB I+D on chip per core |
| Tertiary Cache: | 39424 KB I+D on chip per chip |
| Other Cache: | None |
| Memory Amount (GB): | 192 |
| # and size of DIMM: | 12 x 16384 MB |
| Memory Details: | 12 x 16GB 2Rx8 PC4-2666-V ECC; slots 1, 3, 5, 8, 10 and 12 populated on each CPU socket |
| Power Supply Quantity and Rating (W): | None |
| Power Supply Details: | Shared |
| Disk Drive: | 1 x HPE Synergy 480 Gen10 M.2 FIO Adapter Board Kit (873165-B21); 1 x HPE 480GB SATA 6G Read Intensive M.2 2280 SSD (875498-B21) |
| Disk Controller: | 1 x HPE Smart Array S100i SR Gen10 |
| # and type of Network Interface Cards (NICs) Installed: | 1 x HPE Synergy 3820C 10/20Gb 2-port Converged Network Adapter (777430-B21) |
| NICs Enabled in Firmware / OS / Connected: | 2/1/1 |
| Network Speed (Mbit): | 10000 |
| Keyboard: | None |
| Mouse: | None |
| Monitor: | None |
| Optical Drives: | No |
| Other Hardware: | None |
| Software | |
|---|---|
| Power Management: | Enabled (see SUT Notes) |
| Operating System (OS): | Windows Server 2012 R2 Datacenter |
| OS Version: | 6.3 (Build 9600) |
| Filesystem: | NTFS |
| JVM Vendor: | Oracle Corporation |
| JVM Version: | Java HotSpot(TM) 64-Bit Server VM (build 24.80-b11, mixed mode), version 1.7.0_80 |
| JVM Command-line Options: | -server -Xmn19g -Xms21g -Xmx21g -XX:SurvivorRatio=1 -XX:TargetSurvivorRatio=99 -XX:ParallelGCThreads=28 -XX:AllocatePrefetchDistance=256 -XX:AllocatePrefetchLines=4 -XX:LoopUnrollLimit=45 -XX:InitialTenuringThreshold=12 -XX:MaxTenuringThreshold=15 -XX:InlineSmallCode=9000 -XX:MaxInlineSize=270 -XX:FreqInlineSize=6000 -XX:+UseLargePages -XX:+UseParallelOldGC -XX:+AggressiveOpts |
| JVM Affinity: | start /NODE [0,1,2,3] /AFFINITY [0xFFFFFFF] |
| JVM Instances: | 4 |
| JVM Initial Heap (MB): | 21000 |
| JVM Maximum Heap (MB): | 21000 |
| JVM Address Bits: | 64 |
| Boot Firmware Version: | I42 v1.32 (02/01/2018) |
| Management Firmware Version: | 1.15 Aug 17 2017 |
| Workload Version: | SSJ 1.2.10 |
| Director Location: | Controller |
| Other Software: | HPE Composer Version 3.10.07 (HPE OneView) with HPE Synergy Custom SPP Bundle 2017.10.20180323; Microsoft Windows KB4054519, KB4056898 |
| JVM Instance | ssj_ops@100% |
|---|---|
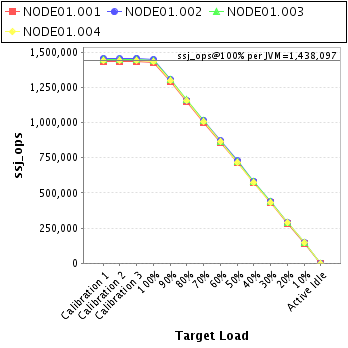
| NODE01.001 | 1,426,600 |
| NODE01.002 | 1,449,385 |
| NODE01.003 | 1,441,547 |
| NODE01.004 | 1,434,856 |
| ssj_ops@100% | 5,752,388 |
| ssj_ops@100% per JVM | 1,438,097 |
| Target Load | Actual Load | ssj_ops | |
|---|---|---|---|
| Target | Actual | ||
| Calibration 1 | 1,431,724 | ||
| Calibration 2 | 1,433,779 | ||
| Calibration 3 | 1,435,327 | ||
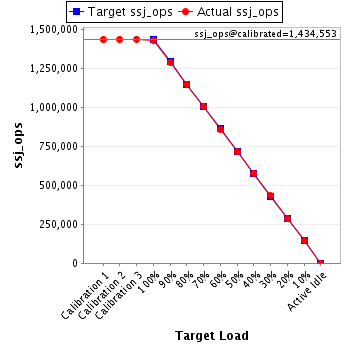
| ssj_ops@calibrated=1,434,553 | |||
| 100% | 99.4% | 1,434,553 | 1,426,600 |
| 90% | 89.8% | 1,291,098 | 1,288,379 |
| 80% | 80.0% | 1,147,643 | 1,147,224 |
| 70% | 70.0% | 1,004,187 | 1,003,907 |
| 60% | 59.8% | 860,732 | 857,772 |
| 50% | 49.8% | 717,277 | 713,896 |
| 40% | 40.0% | 573,821 | 574,476 |
| 30% | 30.1% | 430,366 | 431,480 |
| 20% | 19.9% | 286,911 | 285,281 |
| 10% | 10.0% | 143,455 | 143,696 |
| Active Idle | 0 | 0 | |
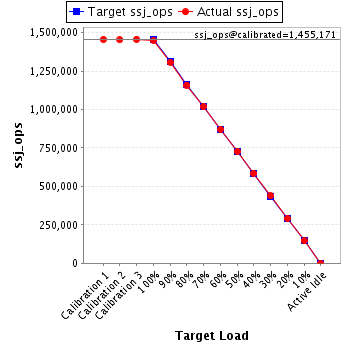
| Target Load | Actual Load | ssj_ops | |
|---|---|---|---|
| Target | Actual | ||
| Calibration 1 | 1,455,525 | ||
| Calibration 2 | 1,452,860 | ||
| Calibration 3 | 1,457,482 | ||
| ssj_ops@calibrated=1,455,171 | |||
| 100% | 99.6% | 1,455,171 | 1,449,385 |
| 90% | 89.9% | 1,309,654 | 1,307,717 |
| 80% | 79.7% | 1,164,137 | 1,159,254 |
| 70% | 70.0% | 1,018,620 | 1,017,897 |
| 60% | 59.9% | 873,103 | 872,001 |
| 50% | 50.0% | 727,586 | 726,945 |
| 40% | 40.2% | 582,068 | 584,421 |
| 30% | 30.1% | 436,551 | 437,558 |
| 20% | 20.0% | 291,034 | 291,683 |
| 10% | 10.0% | 145,517 | 145,521 |
| Active Idle | 0 | 0 | |
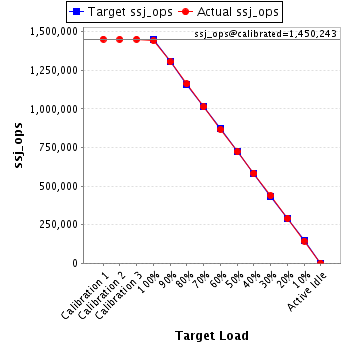
| Target Load | Actual Load | ssj_ops | |
|---|---|---|---|
| Target | Actual | ||
| Calibration 1 | 1,451,034 | ||
| Calibration 2 | 1,449,730 | ||
| Calibration 3 | 1,450,756 | ||
| ssj_ops@calibrated=1,450,243 | |||
| 100% | 99.4% | 1,450,243 | 1,441,547 |
| 90% | 89.9% | 1,305,219 | 1,304,268 |
| 80% | 80.1% | 1,160,194 | 1,161,167 |
| 70% | 69.8% | 1,015,170 | 1,012,963 |
| 60% | 59.8% | 870,146 | 866,800 |
| 50% | 49.8% | 725,122 | 722,131 |
| 40% | 40.1% | 580,097 | 581,876 |
| 30% | 30.1% | 435,073 | 437,037 |
| 20% | 20.1% | 290,049 | 290,824 |
| 10% | 9.9% | 145,024 | 144,040 |
| Active Idle | 0 | 0 | |
| Target Load | Actual Load | ssj_ops | |
|---|---|---|---|
| Target | Actual | ||
| Calibration 1 | 1,439,433 | ||
| Calibration 2 | 1,439,849 | ||
| Calibration 3 | 1,442,914 | ||
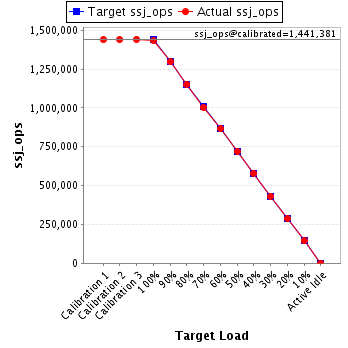
| ssj_ops@calibrated=1,441,381 | |||
| 100% | 99.5% | 1,441,381 | 1,434,856 |
| 90% | 90.0% | 1,297,243 | 1,296,774 |
| 80% | 80.0% | 1,153,105 | 1,153,273 |
| 70% | 69.7% | 1,008,967 | 1,004,178 |
| 60% | 60.1% | 864,829 | 866,118 |
| 50% | 49.9% | 720,691 | 719,514 |
| 40% | 40.0% | 576,553 | 577,032 |
| 30% | 29.9% | 432,414 | 431,294 |
| 20% | 20.0% | 288,276 | 288,531 |
| 10% | 10.0% | 144,138 | 144,447 |
| Active Idle | 0 | 0 | |