SPECpower_ssj2008
Host 'Node05' Performance Report
Copyright © 2007-2018 Standard Performance Evaluation Corporation
| Hewlett Packard Enterprise Synergy 660 Gen10 Compute Module | ssj_ops@100% = 11,541,895 ssj_ops@100% per JVM = 1,442,737 |
||||
| Test Sponsor: | Hewlett Packard Enterprise | SPEC License #: | 3 | Test Method: | Multi Node |
| Tested By: | Hewlett Packard Enterprise | Test Location: | Houston, TX, USA | Test Date: | Apr 10, 2018 |
| Hardware Availability: | Jun-2018 | Software Availability: | Mar-2018 | Publication: | Apr 26, 2018 |
| System Source: | Single Supplier | System Designation: | Server | Power Provisioning: | Line-powered |
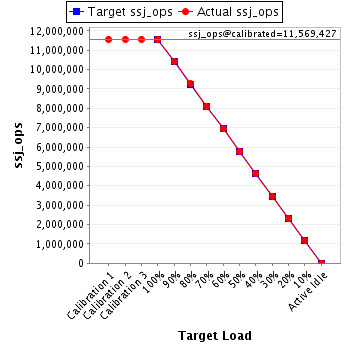
| Target Load | Actual Load | ssj_ops | |
|---|---|---|---|
| Target | Actual | ||
| Calibration 1 | 11,556,215 | ||
| Calibration 2 | 11,567,737 | ||
| Calibration 3 | 11,571,117 | ||
| ssj_ops@calibrated=11,569,427 | |||
| 100% | 99.8% | 11,569,427 | 11,541,895 |
| 90% | 89.9% | 10,412,484 | 10,405,791 |
| 80% | 80.0% | 9,255,542 | 9,259,532 |
| 70% | 70.0% | 8,098,599 | 8,101,676 |
| 60% | 60.0% | 6,941,656 | 6,936,080 |
| 50% | 50.0% | 5,784,714 | 5,781,688 |
| 40% | 40.1% | 4,627,771 | 4,635,596 |
| 30% | 30.0% | 3,470,828 | 3,468,293 |
| 20% | 20.0% | 2,313,885 | 2,311,308 |
| 10% | 10.0% | 1,156,943 | 1,159,776 |
| Active Idle | 0 | 0 | |
| Set Identifier: | SUT |
| Set Description: | System Under Test |
| # of Identical Nodes: | 6 |
| Comment: | SUT |
| Hardware | |
|---|---|
| Hardware Vendor: | Hewlett Packard Enterprise |
| Model: | Synergy 660 Gen10 Compute Module |
| Form Factor: | Other |
| CPU Name: | Intel Xeon Platinum 8180 2.50GHz |
| CPU Characteristics: | 28-Core, 2.50 GHz, 38.5MB L3 Cache |
| CPU Frequency (MHz): | 2500 |
| CPU(s) Enabled: | 112 cores, 4 chips, 28 cores/chip |
| Hardware Threads: | 224 (2 / core) |
| CPU(s) Orderable: | 1,2,3,4 chips |
| Primary Cache: | 32 KB I + 32 KB D on chip per core |
| Secondary Cache: | 1 MB I+D on chip per core |
| Tertiary Cache: | 39424 KB I+D on chip per chip |
| Other Cache: | None |
| Memory Amount (GB): | 384 |
| # and size of DIMM: | 24 x 16384 MB |
| Memory Details: | 24 x 16GB 2Rx8 PC4-2666-V ECC; slots 1, 3, 5, 8, 10 and 12 populated on each CPU socket |
| Power Supply Quantity and Rating (W): | None |
| Power Supply Details: | Shared |
| Disk Drive: | 1 x HPE 480GB SATA 6G Read Intensive M.2 (875319-B21) |
| Disk Controller: | 1 x HPE Smart Array S100i SR Gen10 |
| # and type of Network Interface Cards (NICs) Installed: | 1 x HPE Synergy 3820C 10/20Gb 2-port Converged Network Adapter (777430-B21) |
| NICs Enabled in Firmware / OS / Connected: | 2/1/1 |
| Network Speed (Mbit): | 10000 |
| Keyboard: | None |
| Mouse: | None |
| Monitor: | None |
| Optical Drives: | No |
| Other Hardware: | None |
| Software | |
|---|---|
| Power Management: | Enabled (see SUT Notes) |
| Operating System (OS): | Windows Server 2012 R2 Datacenter |
| OS Version: | Version 6.3 (Build 9600) |
| Filesystem: | NTFS |
| JVM Vendor: | Oracle Corporation |
| JVM Version: | Oracle Java HotSpot(TM) 64-Bit Server VM (build 24.80-b11, mixed mode), version 1.7.0_80 |
| JVM Command-line Options: | -server -Xmn19g -Xms21g -Xmx21g -XX:SurvivorRatio=1 -XX:TargetSurvivorRatio=99 -XX:AllocatePrefetchDistance=256 -XX:AllocatePrefetchLines=4 -XX:LoopUnrollLimit=30 -XX:InitialTenuringThreshold=12 -XX:MaxTenuringThreshold=15 -XX:ParallelGCThreads=28 -XX:InlineSmallCode=3900 -XX:MaxInlineSize=270 -XX:FreqInlineSize=2500 -XX:+AggressiveOpts -XX:+UseLargePages -XX:+UseParallelOldGC |
| JVM Affinity: | start /NODE [0,2,4,6] /AFFINITY [0x0000000FC0FF, 0xFC0FF0000000]; start /NODE [1,3,5,7] /AFFINITY [0x0000000FF03F,0xFF03F0000000] |
| JVM Instances: | 8 |
| JVM Initial Heap (MB): | 21000 |
| JVM Maximum Heap (MB): | 21000 |
| JVM Address Bits: | 64 |
| Boot Firmware Version: | I43 v1.32 (02/01/2018) |
| Management Firmware Version: | 1.15 August 17 2017 |
| Workload Version: | SSJ 1.2.10 |
| Director Location: | Controller |
| Other Software: | HPE Composer Version 3.10.07 (HPE OneView) with HPE Synergy Custom SPP Bundle 2017.10.20180323; Microsoft Windows KB4054519, KB4056898 |
| JVM Instance | ssj_ops@100% |
|---|---|
| Node05.001 | 1,438,748 |
| Node05.002 | 1,436,616 |
| Node05.003 | 1,433,365 |
| Node05.004 | 1,446,880 |
| Node05.005 | 1,441,381 |
| Node05.006 | 1,443,114 |
| Node05.007 | 1,454,700 |
| Node05.008 | 1,447,091 |
| ssj_ops@100% | 11,541,895 |
| ssj_ops@100% per JVM | 1,442,737 |

| Target Load | Actual Load | ssj_ops | |
|---|---|---|---|
| Target | Actual | ||
| Calibration 1 | 1,439,768 | ||
| Calibration 2 | 1,442,751 | ||
| Calibration 3 | 1,443,098 | ||
| ssj_ops@calibrated=1,442,925 | |||
| 100% | 99.7% | 1,442,925 | 1,438,748 |
| 90% | 90.1% | 1,298,632 | 1,300,639 |
| 80% | 80.1% | 1,154,340 | 1,156,300 |
| 70% | 69.9% | 1,010,047 | 1,008,913 |
| 60% | 60.1% | 865,755 | 866,586 |
| 50% | 49.8% | 721,462 | 719,285 |
| 40% | 39.9% | 577,170 | 576,412 |
| 30% | 30.0% | 432,877 | 433,499 |
| 20% | 20.2% | 288,585 | 291,136 |
| 10% | 10.0% | 144,292 | 144,994 |
| Active Idle | 0 | 0 | |

| Target Load | Actual Load | ssj_ops | |
|---|---|---|---|
| Target | Actual | ||
| Calibration 1 | 1,442,482 | ||
| Calibration 2 | 1,438,298 | ||
| Calibration 3 | 1,439,728 | ||
| ssj_ops@calibrated=1,439,013 | |||
| 100% | 99.8% | 1,439,013 | 1,436,616 |
| 90% | 89.9% | 1,295,112 | 1,293,361 |
| 80% | 80.0% | 1,151,210 | 1,151,929 |
| 70% | 69.8% | 1,007,309 | 1,004,456 |
| 60% | 59.7% | 863,408 | 859,510 |
| 50% | 49.9% | 719,507 | 718,379 |
| 40% | 39.9% | 575,605 | 574,462 |
| 30% | 30.0% | 431,704 | 431,444 |
| 20% | 19.9% | 287,803 | 286,958 |
| 10% | 10.0% | 143,901 | 144,510 |
| Active Idle | 0 | 0 | |

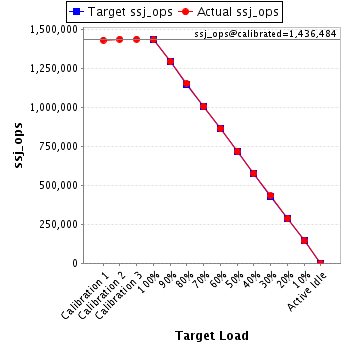
| Target Load | Actual Load | ssj_ops | |
|---|---|---|---|
| Target | Actual | ||
| Calibration 1 | 1,430,517 | ||
| Calibration 2 | 1,436,321 | ||
| Calibration 3 | 1,436,647 | ||
| ssj_ops@calibrated=1,436,484 | |||
| 100% | 99.8% | 1,436,484 | 1,433,365 |
| 90% | 90.0% | 1,292,836 | 1,293,271 |
| 80% | 80.2% | 1,149,187 | 1,151,990 |
| 70% | 70.0% | 1,005,539 | 1,005,767 |
| 60% | 60.1% | 861,890 | 863,172 |
| 50% | 49.9% | 718,242 | 716,896 |
| 40% | 40.1% | 574,594 | 576,206 |
| 30% | 30.0% | 430,945 | 431,262 |
| 20% | 20.0% | 287,297 | 287,088 |
| 10% | 10.0% | 143,648 | 143,611 |
| Active Idle | 0 | 0 | |
| Target Load | Actual Load | ssj_ops | |
|---|---|---|---|
| Target | Actual | ||
| Calibration 1 | 1,449,763 | ||
| Calibration 2 | 1,450,243 | ||
| Calibration 3 | 1,450,228 | ||
| ssj_ops@calibrated=1,450,235 | |||
| 100% | 99.8% | 1,450,235 | 1,446,880 |
| 90% | 90.1% | 1,305,212 | 1,305,980 |
| 80% | 80.2% | 1,160,188 | 1,162,584 |
| 70% | 70.0% | 1,015,165 | 1,015,039 |
| 60% | 59.4% | 870,141 | 861,877 |
| 50% | 50.1% | 725,118 | 726,937 |
| 40% | 40.2% | 580,094 | 582,377 |
| 30% | 30.0% | 435,071 | 435,224 |
| 20% | 19.9% | 290,047 | 289,310 |
| 10% | 10.0% | 145,024 | 144,441 |
| Active Idle | 0 | 0 | |

| Target Load | Actual Load | ssj_ops | |
|---|---|---|---|
| Target | Actual | ||
| Calibration 1 | 1,442,016 | ||
| Calibration 2 | 1,444,242 | ||
| Calibration 3 | 1,445,004 | ||
| ssj_ops@calibrated=1,444,623 | |||
| 100% | 99.8% | 1,444,623 | 1,441,381 |
| 90% | 89.8% | 1,300,161 | 1,297,398 |
| 80% | 79.9% | 1,155,698 | 1,153,638 |
| 70% | 70.2% | 1,011,236 | 1,014,720 |
| 60% | 60.1% | 866,774 | 867,846 |
| 50% | 49.9% | 722,312 | 720,758 |
| 40% | 40.1% | 577,849 | 579,067 |
| 30% | 29.9% | 433,387 | 431,440 |
| 20% | 20.0% | 288,925 | 288,273 |
| 10% | 10.0% | 144,462 | 144,889 |
| Active Idle | 0 | 0 | |

| Target Load | Actual Load | ssj_ops | |
|---|---|---|---|
| Target | Actual | ||
| Calibration 1 | 1,445,449 | ||
| Calibration 2 | 1,447,191 | ||
| Calibration 3 | 1,445,388 | ||
| ssj_ops@calibrated=1,446,290 | |||
| 100% | 99.8% | 1,446,290 | 1,443,114 |
| 90% | 89.6% | 1,301,661 | 1,295,383 |
| 80% | 80.0% | 1,157,032 | 1,157,000 |
| 70% | 70.0% | 1,012,403 | 1,012,414 |
| 60% | 60.0% | 867,774 | 868,027 |
| 50% | 49.9% | 723,145 | 721,413 |
| 40% | 40.3% | 578,516 | 583,367 |
| 30% | 29.9% | 433,887 | 433,039 |
| 20% | 20.0% | 289,258 | 289,361 |
| 10% | 10.1% | 144,629 | 145,971 |
| Active Idle | 0 | 0 | |

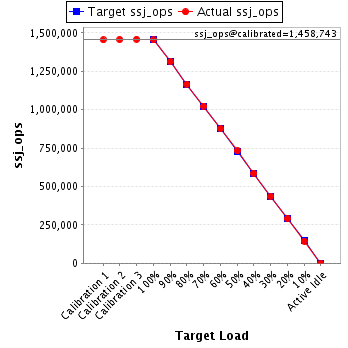
| Target Load | Actual Load | ssj_ops | |
|---|---|---|---|
| Target | Actual | ||
| Calibration 1 | 1,454,708 | ||
| Calibration 2 | 1,457,743 | ||
| Calibration 3 | 1,459,743 | ||
| ssj_ops@calibrated=1,458,743 | |||
| 100% | 99.7% | 1,458,743 | 1,454,700 |
| 90% | 89.9% | 1,312,869 | 1,311,996 |
| 80% | 80.0% | 1,166,994 | 1,167,106 |
| 70% | 70.2% | 1,021,120 | 1,024,387 |
| 60% | 60.0% | 875,246 | 875,609 |
| 50% | 50.2% | 729,372 | 732,213 |
| 40% | 40.1% | 583,497 | 585,542 |
| 30% | 30.0% | 437,623 | 437,147 |
| 20% | 19.9% | 291,749 | 290,567 |
| 10% | 9.9% | 145,874 | 144,930 |
| Active Idle | 0 | 0 | |
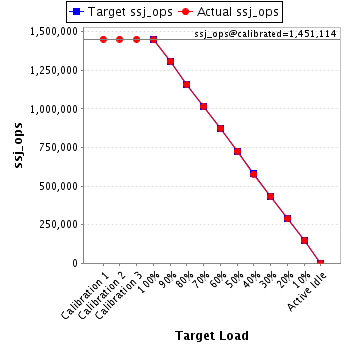
| Target Load | Actual Load | ssj_ops | |
|---|---|---|---|
| Target | Actual | ||
| Calibration 1 | 1,451,512 | ||
| Calibration 2 | 1,450,947 | ||
| Calibration 3 | 1,451,281 | ||
| ssj_ops@calibrated=1,451,114 | |||
| 100% | 99.7% | 1,451,114 | 1,447,091 |
| 90% | 90.1% | 1,306,003 | 1,307,763 |
| 80% | 79.9% | 1,160,891 | 1,158,984 |
| 70% | 70.0% | 1,015,780 | 1,015,981 |
| 60% | 60.2% | 870,669 | 873,453 |
| 50% | 50.0% | 725,557 | 725,805 |
| 40% | 39.8% | 580,446 | 578,163 |
| 30% | 30.0% | 435,334 | 435,239 |
| 20% | 19.9% | 290,223 | 288,616 |
| 10% | 10.1% | 145,111 | 146,430 |
| Active Idle | 0 | 0 | |