
SPECpower_ssj2008
Host 'Node01' Performance Report
Copyright © 2007-2018 Standard Performance Evaluation Corporation
| Hewlett Packard Enterprise Synergy 660 Gen10 Compute Module | ssj_ops@100% = 11,595,429 ssj_ops@100% per JVM = 1,449,429 |
||||
| Test Sponsor: | Hewlett Packard Enterprise | SPEC License #: | 3 | Test Method: | Multi Node |
| Tested By: | Hewlett Packard Enterprise | Test Location: | Houston, TX, USA | Test Date: | Apr 10, 2018 |
| Hardware Availability: | Jun-2018 | Software Availability: | Mar-2018 | Publication: | Apr 26, 2018 |
| System Source: | Single Supplier | System Designation: | Server | Power Provisioning: | Line-powered |
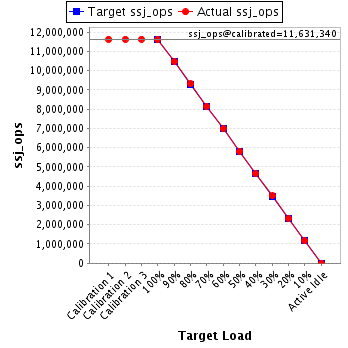
| Target Load | Actual Load | ssj_ops | |
|---|---|---|---|
| Target | Actual | ||
| Calibration 1 | 11,628,144 | ||
| Calibration 2 | 11,629,660 | ||
| Calibration 3 | 11,633,020 | ||
| ssj_ops@calibrated=11,631,340 | |||
| 100% | 99.7% | 11,631,340 | 11,595,429 |
| 90% | 90.0% | 10,468,206 | 10,464,952 |
| 80% | 80.0% | 9,305,072 | 9,307,092 |
| 70% | 70.0% | 8,141,938 | 8,139,523 |
| 60% | 60.0% | 6,978,804 | 6,978,146 |
| 50% | 50.0% | 5,815,670 | 5,814,576 |
| 40% | 40.0% | 4,652,536 | 4,655,296 |
| 30% | 30.0% | 3,489,402 | 3,493,118 |
| 20% | 20.1% | 2,326,268 | 2,333,182 |
| 10% | 10.0% | 1,163,134 | 1,163,976 |
| Active Idle | 0 | 0 | |
| Set Identifier: | SUT |
| Set Description: | System Under Test |
| # of Identical Nodes: | 6 |
| Comment: | SUT |
| Hardware | |
|---|---|
| Hardware Vendor: | Hewlett Packard Enterprise |
| Model: | Synergy 660 Gen10 Compute Module |
| Form Factor: | Other |
| CPU Name: | Intel Xeon Platinum 8180 2.50GHz |
| CPU Characteristics: | 28-Core, 2.50 GHz, 38.5MB L3 Cache |
| CPU Frequency (MHz): | 2500 |
| CPU(s) Enabled: | 112 cores, 4 chips, 28 cores/chip |
| Hardware Threads: | 224 (2 / core) |
| CPU(s) Orderable: | 1,2,3,4 chips |
| Primary Cache: | 32 KB I + 32 KB D on chip per core |
| Secondary Cache: | 1 MB I+D on chip per core |
| Tertiary Cache: | 39424 KB I+D on chip per chip |
| Other Cache: | None |
| Memory Amount (GB): | 384 |
| # and size of DIMM: | 24 x 16384 MB |
| Memory Details: | 24 x 16GB 2Rx8 PC4-2666-V ECC; slots 1, 3, 5, 8, 10 and 12 populated on each CPU socket |
| Power Supply Quantity and Rating (W): | None |
| Power Supply Details: | Shared |
| Disk Drive: | 1 x HPE 480GB SATA 6G Read Intensive M.2 (875319-B21) |
| Disk Controller: | 1 x HPE Smart Array S100i SR Gen10 |
| # and type of Network Interface Cards (NICs) Installed: | 1 x HPE Synergy 3820C 10/20Gb 2-port Converged Network Adapter (777430-B21) |
| NICs Enabled in Firmware / OS / Connected: | 2/1/1 |
| Network Speed (Mbit): | 10000 |
| Keyboard: | None |
| Mouse: | None |
| Monitor: | None |
| Optical Drives: | No |
| Other Hardware: | None |
| Software | |
|---|---|
| Power Management: | Enabled (see SUT Notes) |
| Operating System (OS): | Windows Server 2012 R2 Datacenter |
| OS Version: | Version 6.3 (Build 9600) |
| Filesystem: | NTFS |
| JVM Vendor: | Oracle Corporation |
| JVM Version: | Oracle Java HotSpot(TM) 64-Bit Server VM (build 24.80-b11, mixed mode), version 1.7.0_80 |
| JVM Command-line Options: | -server -Xmn19g -Xms21g -Xmx21g -XX:SurvivorRatio=1 -XX:TargetSurvivorRatio=99 -XX:AllocatePrefetchDistance=256 -XX:AllocatePrefetchLines=4 -XX:LoopUnrollLimit=30 -XX:InitialTenuringThreshold=12 -XX:MaxTenuringThreshold=15 -XX:ParallelGCThreads=28 -XX:InlineSmallCode=3900 -XX:MaxInlineSize=270 -XX:FreqInlineSize=2500 -XX:+AggressiveOpts -XX:+UseLargePages -XX:+UseParallelOldGC |
| JVM Affinity: | start /NODE [0,2,4,6] /AFFINITY [0x0000000FC0FF, 0xFC0FF0000000]; start /NODE [1,3,5,7] /AFFINITY [0x0000000FF03F,0xFF03F0000000] |
| JVM Instances: | 8 |
| JVM Initial Heap (MB): | 21000 |
| JVM Maximum Heap (MB): | 21000 |
| JVM Address Bits: | 64 |
| Boot Firmware Version: | I43 v1.32 (02/01/2018) |
| Management Firmware Version: | 1.15 August 17 2017 |
| Workload Version: | SSJ 1.2.10 |
| Director Location: | Controller |
| Other Software: | HPE Composer Version 3.10.07 (HPE OneView) with HPE Synergy Custom SPP Bundle 2017.10.20180323; Microsoft Windows KB4054519, KB4056898 |
| JVM Instance | ssj_ops@100% |
|---|---|
| Node01.001 | 1,445,214 |
| Node01.002 | 1,450,509 |
| Node01.003 | 1,440,776 |
| Node01.004 | 1,437,913 |
| Node01.005 | 1,459,822 |
| Node01.006 | 1,453,532 |
| Node01.007 | 1,460,395 |
| Node01.008 | 1,447,267 |
| ssj_ops@100% | 11,595,429 |
| ssj_ops@100% per JVM | 1,449,429 |

| Target Load | Actual Load | ssj_ops | |
|---|---|---|---|
| Target | Actual | ||
| Calibration 1 | 1,450,050 | ||
| Calibration 2 | 1,449,556 | ||
| Calibration 3 | 1,450,960 | ||
| ssj_ops@calibrated=1,450,258 | |||
| 100% | 99.7% | 1,450,258 | 1,445,214 |
| 90% | 90.1% | 1,305,232 | 1,306,551 |
| 80% | 79.8% | 1,160,206 | 1,157,741 |
| 70% | 69.9% | 1,015,180 | 1,013,716 |
| 60% | 59.9% | 870,155 | 868,074 |
| 50% | 49.9% | 725,129 | 723,113 |
| 40% | 40.0% | 580,103 | 580,208 |
| 30% | 30.0% | 435,077 | 434,638 |
| 20% | 20.0% | 290,052 | 290,427 |
| 10% | 10.0% | 145,026 | 145,504 |
| Active Idle | 0 | 0 | |

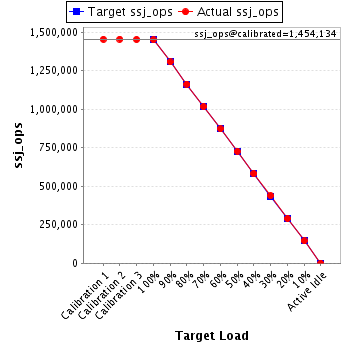
| Target Load | Actual Load | ssj_ops | |
|---|---|---|---|
| Target | Actual | ||
| Calibration 1 | 1,454,165 | ||
| Calibration 2 | 1,455,011 | ||
| Calibration 3 | 1,453,257 | ||
| ssj_ops@calibrated=1,454,134 | |||
| 100% | 99.8% | 1,454,134 | 1,450,509 |
| 90% | 89.9% | 1,308,720 | 1,307,162 |
| 80% | 80.0% | 1,163,307 | 1,163,081 |
| 70% | 70.0% | 1,017,894 | 1,018,210 |
| 60% | 60.0% | 872,480 | 872,146 |
| 50% | 50.0% | 727,067 | 727,206 |
| 40% | 40.0% | 581,654 | 581,401 |
| 30% | 30.1% | 436,240 | 438,165 |
| 20% | 20.0% | 290,827 | 290,195 |
| 10% | 10.0% | 145,413 | 145,007 |
| Active Idle | 0 | 0 | |
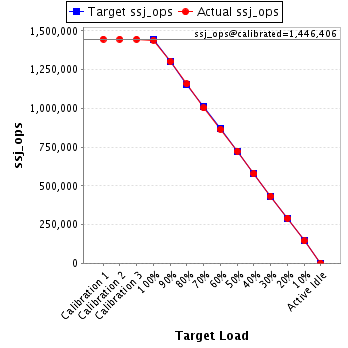
| Target Load | Actual Load | ssj_ops | |
|---|---|---|---|
| Target | Actual | ||
| Calibration 1 | 1,446,935 | ||
| Calibration 2 | 1,446,160 | ||
| Calibration 3 | 1,446,652 | ||
| ssj_ops@calibrated=1,446,406 | |||
| 100% | 99.6% | 1,446,406 | 1,440,776 |
| 90% | 90.1% | 1,301,766 | 1,303,078 |
| 80% | 80.1% | 1,157,125 | 1,158,056 |
| 70% | 69.3% | 1,012,484 | 1,002,801 |
| 60% | 59.8% | 867,844 | 865,139 |
| 50% | 50.0% | 723,203 | 723,296 |
| 40% | 39.9% | 578,563 | 577,005 |
| 30% | 30.0% | 433,922 | 433,894 |
| 20% | 20.2% | 289,281 | 291,642 |
| 10% | 10.0% | 144,641 | 144,191 |
| Active Idle | 0 | 0 | |
| Target Load | Actual Load | ssj_ops | |
|---|---|---|---|
| Target | Actual | ||
| Calibration 1 | 1,441,661 | ||
| Calibration 2 | 1,442,463 | ||
| Calibration 3 | 1,440,657 | ||
| ssj_ops@calibrated=1,441,560 | |||
| 100% | 99.7% | 1,441,560 | 1,437,913 |
| 90% | 89.9% | 1,297,404 | 1,296,454 |
| 80% | 79.9% | 1,153,248 | 1,152,517 |
| 70% | 70.0% | 1,009,092 | 1,009,275 |
| 60% | 60.2% | 864,936 | 867,532 |
| 50% | 50.0% | 720,780 | 721,476 |
| 40% | 40.0% | 576,624 | 576,253 |
| 30% | 30.2% | 432,468 | 434,639 |
| 20% | 20.2% | 288,312 | 290,768 |
| 10% | 10.1% | 144,156 | 145,056 |
| Active Idle | 0 | 0 | |

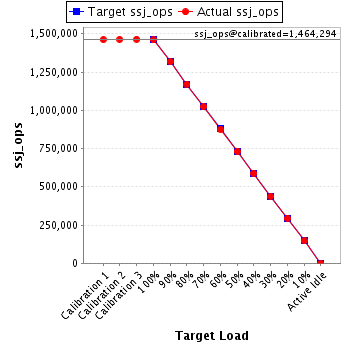
| Target Load | Actual Load | ssj_ops | |
|---|---|---|---|
| Target | Actual | ||
| Calibration 1 | 1,461,338 | ||
| Calibration 2 | 1,463,688 | ||
| Calibration 3 | 1,464,900 | ||
| ssj_ops@calibrated=1,464,294 | |||
| 100% | 99.7% | 1,464,294 | 1,459,822 |
| 90% | 89.9% | 1,317,864 | 1,317,076 |
| 80% | 80.0% | 1,171,435 | 1,171,723 |
| 70% | 69.9% | 1,025,006 | 1,023,507 |
| 60% | 59.8% | 878,576 | 875,624 |
| 50% | 49.9% | 732,147 | 730,707 |
| 40% | 40.1% | 585,717 | 587,656 |
| 30% | 29.9% | 439,288 | 437,847 |
| 20% | 20.0% | 292,859 | 293,569 |
| 10% | 10.0% | 146,429 | 146,566 |
| Active Idle | 0 | 0 | |
| Target Load | Actual Load | ssj_ops | |
|---|---|---|---|
| Target | Actual | ||
| Calibration 1 | 1,456,734 | ||
| Calibration 2 | 1,456,852 | ||
| Calibration 3 | 1,456,976 | ||
| ssj_ops@calibrated=1,456,914 | |||
| 100% | 99.8% | 1,456,914 | 1,453,532 |
| 90% | 90.0% | 1,311,223 | 1,310,815 |
| 80% | 80.2% | 1,165,531 | 1,169,006 |
| 70% | 70.4% | 1,019,840 | 1,025,273 |
| 60% | 60.1% | 874,148 | 875,538 |
| 50% | 50.1% | 728,457 | 729,882 |
| 40% | 40.2% | 582,766 | 585,149 |
| 30% | 30.0% | 437,074 | 437,076 |
| 20% | 20.0% | 291,383 | 291,754 |
| 10% | 10.0% | 145,691 | 146,039 |
| Active Idle | 0 | 0 | |

| Target Load | Actual Load | ssj_ops | |
|---|---|---|---|
| Target | Actual | ||
| Calibration 1 | 1,466,616 | ||
| Calibration 2 | 1,463,291 | ||
| Calibration 3 | 1,464,825 | ||
| ssj_ops@calibrated=1,464,058 | |||
| 100% | 99.7% | 1,464,058 | 1,460,395 |
| 90% | 89.8% | 1,317,652 | 1,314,867 |
| 80% | 80.1% | 1,171,246 | 1,172,099 |
| 70% | 70.1% | 1,024,841 | 1,025,961 |
| 60% | 60.1% | 878,435 | 880,448 |
| 50% | 50.0% | 732,029 | 731,492 |
| 40% | 40.0% | 585,623 | 586,270 |
| 30% | 30.0% | 439,217 | 439,297 |
| 20% | 20.1% | 292,812 | 294,864 |
| 10% | 10.0% | 146,406 | 145,947 |
| Active Idle | 0 | 0 | |

| Target Load | Actual Load | ssj_ops | |
|---|---|---|---|
| Target | Actual | ||
| Calibration 1 | 1,450,645 | ||
| Calibration 2 | 1,452,639 | ||
| Calibration 3 | 1,454,793 | ||
| ssj_ops@calibrated=1,453,716 | |||
| 100% | 99.6% | 1,453,716 | 1,447,267 |
| 90% | 90.0% | 1,308,345 | 1,308,950 |
| 80% | 80.0% | 1,162,973 | 1,162,869 |
| 70% | 70.2% | 1,017,601 | 1,020,778 |
| 60% | 60.1% | 872,230 | 873,646 |
| 50% | 50.0% | 726,858 | 727,404 |
| 40% | 40.0% | 581,487 | 581,355 |
| 30% | 30.1% | 436,115 | 437,561 |
| 20% | 19.9% | 290,743 | 289,962 |
| 10% | 10.0% | 145,372 | 145,666 |
| Active Idle | 0 | 0 | |
