SPECpower_ssj2008
Host 'WINDOWS-2KQ3HK3' Performance Report
Copyright © 2007-2017 Standard Performance Evaluation Corporation
| Quanta Computer Inc. QuantaGrid T42S-2U | ssj_ops@100% = 4,885,686 ssj_ops@100% per JVM = 1,221,422 |
||||
| Test Sponsor: | Quanta Computer Inc. | SPEC License #: | 9050 | Test Method: | Multi Node |
| Tested By: | Quanta Computer Inc. | Test Location: | Taoyuan, TW, R.O.C | Test Date: | Sep 26, 2017 |
| Hardware Availability: | Jul-2017 | Software Availability: | Sep-2016 | Publication: | Oct 25, 2017 |
| System Source: | Single Supplier | System Designation: | Server | Power Provisioning: | Line-powered |
| Target Load | Actual Load | ssj_ops | |
|---|---|---|---|
| Target | Actual | ||
| Calibration 1 | 4,968,208 | ||
| Calibration 2 | 4,908,781 | ||
| Calibration 3 | 4,905,385 | ||
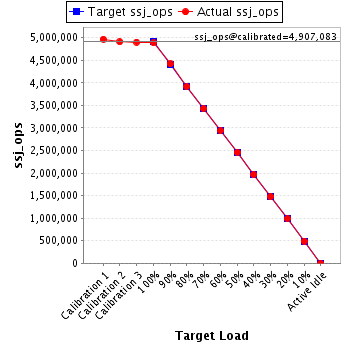
| ssj_ops@calibrated=4,907,083 | |||
| 100% | 99.6% | 4,907,083 | 4,885,686 |
| 90% | 90.0% | 4,416,375 | 4,417,849 |
| 80% | 79.9% | 3,925,667 | 3,919,410 |
| 70% | 69.8% | 3,434,958 | 3,424,171 |
| 60% | 59.9% | 2,944,250 | 2,938,679 |
| 50% | 50.2% | 2,453,542 | 2,462,054 |
| 40% | 40.0% | 1,962,833 | 1,964,214 |
| 30% | 30.1% | 1,472,125 | 1,475,055 |
| 20% | 20.1% | 981,417 | 984,615 |
| 10% | 10.0% | 490,708 | 491,581 |
| Active Idle | 0 | 0 | |
| Set Identifier: | T42S-2U |
| Set Description: | System Under Test |
| # of Identical Nodes: | 4 |
| Comment: | None |
| Hardware | |
|---|---|
| Hardware Vendor: | Quanta Computer Inc. |
| Model: | QuantaGrid T42S-2U |
| Form Factor: | 2U |
| CPU Name: | Intel Xeon Platinum 8176 |
| CPU Characteristics: | 28 core, 2.10GHz, 38.5MB L3 Cache |
| CPU Frequency (MHz): | 2100 |
| CPU(s) Enabled: | 56 cores, 2 chips, 28 cores/chip |
| Hardware Threads: | 112 (2 / core) |
| CPU(s) Orderable: | 1,2 chips |
| Primary Cache: | 32 KB I + 32 KB D on chip per core |
| Secondary Cache: | 1 MB I+D on chip per core |
| Tertiary Cache: | 39424 KB I+D on chip per chip |
| Other Cache: | None |
| Memory Amount (GB): | 192 |
| # and size of DIMM: | 12 x 16384 MB |
| Memory Details: | 16GB 2Rx8 PC4-2666V-RE1-12-PA0; slots A0, B0, C0, D0, E0, F0, populated for both Processor sockets |
| Power Supply Quantity and Rating (W): | 1 x 2200 |
| Power Supply Details: | None |
| Disk Drive: | 1 x 256G SATA SSD,Quanta P/N ABSAV256008 |
| Disk Controller: | Integrated SATA controller |
| # and type of Network Interface Cards (NICs) Installed: | 1 x dual-port Intel I357 Gigabit Ethernet controllerQuanta P/N 3GS5BMA00D0 |
| NICs Enabled in Firmware / OS / Connected: | 2/2/1 |
| Network Speed (Mbit): | 1000 |
| Keyboard: | None |
| Mouse: | None |
| Monitor: | None |
| Optical Drives: | No |
| Other Hardware: | None |
| Software | |
|---|---|
| Power Management: | Balanced power plan in OS |
| Operating System (OS): | Windows Server 2012 R2 Datacenter |
| OS Version: | Version 6.3.9600 (Build 9600 |
| Filesystem: | NTFS |
| JVM Vendor: | Oracle Corporation |
| JVM Version: | Oracle HotSpot(TM) 64-Bit Server VM (build 24.80-b11, mixed mode), version 1.7.0_80 |
| JVM Command-line Options: | -server -Xmx13g -Xms13g -Xmn11g -XX:SurvivorRatio=1 -XX:TargetSurvivorRatio=99 -XX:ParallelGCThreads=24 -XX:AllocatePrefetchDistance=256 -XX:AllocatePrefetchLines=4 -XX:LoopUnrollLimit=45 -XX:InitialTenuringThreshold=12 -XX:MaxTenuringThreshold=15 -XX:InlineSmallCode=9000 -XX:MaxInlineSize=270 -XX:FreqInlineSize=6000 -XX:+UseLargePages -XX:+UseParallelOldGC -XX:+AggressiveOpts -XX:+OptimizeStringConcat -XX:+UseStringCache |
| JVM Affinity: | start /NODE [0,1,2,3] /AFFINITY [0xFFFFFFF] |
| JVM Instances: | 4 |
| JVM Initial Heap (MB): | 13000 |
| JVM Maximum Heap (MB): | 13000 |
| JVM Address Bits: | 64 |
| Boot Firmware Version: | 3A03E7 |
| Management Firmware Version: | 3.20 |
| Workload Version: | SSJ 1.2.10 |
| Director Location: | Controller |
| Other Software: | Specpower_ssj.props input.load_level.number_warehouses set to 112 due to a known inconsistency in processor reporting with this java version |
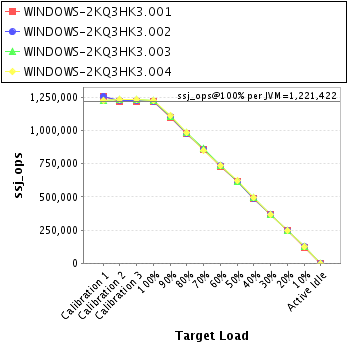
| JVM Instance | ssj_ops@100% |
|---|---|
| WINDOWS-2KQ3HK3.001 | 1,215,014 |
| WINDOWS-2KQ3HK3.002 | 1,219,436 |
| WINDOWS-2KQ3HK3.003 | 1,224,075 |
| WINDOWS-2KQ3HK3.004 | 1,227,162 |
| ssj_ops@100% | 4,885,686 |
| ssj_ops@100% per JVM | 1,221,422 |
| Target Load | Actual Load | ssj_ops | |
|---|---|---|---|
| Target | Actual | ||
| Calibration 1 | 1,257,519 | ||
| Calibration 2 | 1,219,843 | ||
| Calibration 3 | 1,218,152 | ||
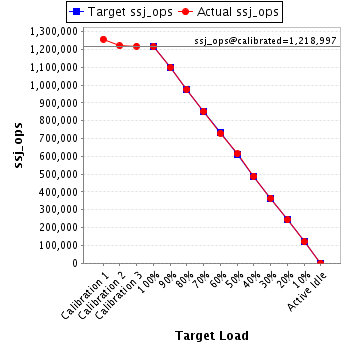
| ssj_ops@calibrated=1,218,997 | |||
| 100% | 99.7% | 1,218,997 | 1,215,014 |
| 90% | 90.2% | 1,097,098 | 1,099,202 |
| 80% | 80.1% | 975,198 | 975,959 |
| 70% | 70.0% | 853,298 | 853,177 |
| 60% | 59.9% | 731,398 | 729,821 |
| 50% | 50.3% | 609,499 | 613,625 |
| 40% | 40.1% | 487,599 | 488,495 |
| 30% | 30.0% | 365,699 | 366,009 |
| 20% | 20.0% | 243,799 | 243,685 |
| 10% | 10.0% | 121,900 | 121,583 |
| Active Idle | 0 | 0 | |
| Target Load | Actual Load | ssj_ops | |
|---|---|---|---|
| Target | Actual | ||
| Calibration 1 | 1,258,045 | ||
| Calibration 2 | 1,225,544 | ||
| Calibration 3 | 1,223,459 | ||
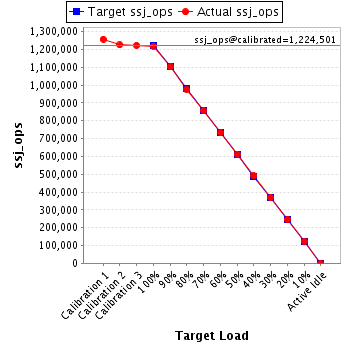
| ssj_ops@calibrated=1,224,501 | |||
| 100% | 99.6% | 1,224,501 | 1,219,436 |
| 90% | 90.0% | 1,102,051 | 1,102,536 |
| 80% | 79.9% | 979,601 | 978,150 |
| 70% | 70.0% | 857,151 | 856,691 |
| 60% | 59.9% | 734,701 | 733,546 |
| 50% | 50.1% | 612,251 | 613,097 |
| 40% | 40.1% | 489,801 | 490,583 |
| 30% | 30.2% | 367,350 | 369,956 |
| 20% | 20.1% | 244,900 | 246,159 |
| 10% | 10.1% | 122,450 | 123,328 |
| Active Idle | 0 | 0 | |
| Target Load | Actual Load | ssj_ops | |
|---|---|---|---|
| Target | Actual | ||
| Calibration 1 | 1,224,949 | ||
| Calibration 2 | 1,229,811 | ||
| Calibration 3 | 1,232,583 | ||
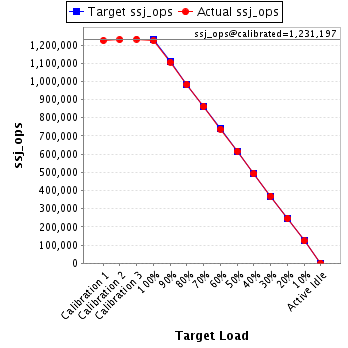
| ssj_ops@calibrated=1,231,197 | |||
| 100% | 99.4% | 1,231,197 | 1,224,075 |
| 90% | 89.9% | 1,108,077 | 1,106,270 |
| 80% | 79.8% | 984,958 | 982,295 |
| 70% | 70.0% | 861,838 | 861,976 |
| 60% | 60.0% | 738,718 | 738,135 |
| 50% | 50.0% | 615,599 | 615,766 |
| 40% | 40.0% | 492,479 | 491,938 |
| 30% | 30.0% | 369,359 | 369,913 |
| 20% | 20.1% | 246,239 | 246,983 |
| 10% | 10.0% | 123,120 | 123,418 |
| Active Idle | 0 | 0 | |
| Target Load | Actual Load | ssj_ops | |
|---|---|---|---|
| Target | Actual | ||
| Calibration 1 | 1,227,695 | ||
| Calibration 2 | 1,233,584 | ||
| Calibration 3 | 1,231,192 | ||
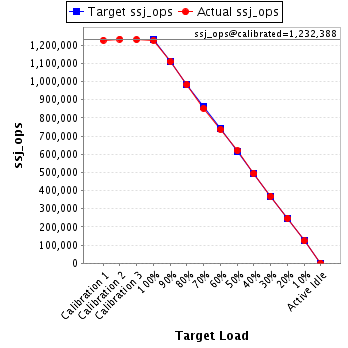
| ssj_ops@calibrated=1,232,388 | |||
| 100% | 99.6% | 1,232,388 | 1,227,162 |
| 90% | 90.1% | 1,109,149 | 1,109,841 |
| 80% | 79.8% | 985,910 | 983,005 |
| 70% | 69.2% | 862,671 | 852,327 |
| 60% | 59.8% | 739,433 | 737,177 |
| 50% | 50.3% | 616,194 | 619,565 |
| 40% | 40.0% | 492,955 | 493,197 |
| 30% | 30.0% | 369,716 | 369,178 |
| 20% | 20.1% | 246,478 | 247,788 |
| 10% | 10.0% | 123,239 | 123,252 |
| Active Idle | 0 | 0 | |