SPECpower_ssj2008
Host 'M610-12' Performance Report
Copyright © 2007-2011 Standard Performance Evaluation Corporation
| Dell Inc. PowerEdge M610 | ssj_ops@100% = 929,900 ssj_ops@100% per JVM = 464,950 |
||||
| Test Sponsor: | Dell Inc. | SPEC License #: | 55 | Test Method: | Multi Node |
| Tested By: | Dell Inc. | Test Location: | Round Rock, TX, USA | Test Date: | Sep 26, 2011 |
| Hardware Availability: | Feb-2011 | Software Availability: | Apr-2011 | Publication: | Nov 2, 2011 |
| System Source: | Single Supplier | System Designation: | Server | Power Provisioning: | Line-powered |
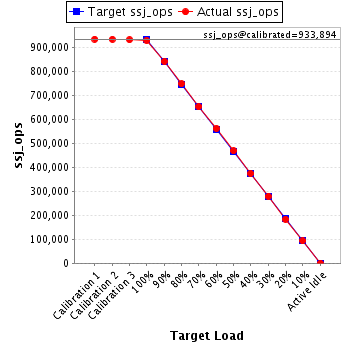
| Target Load | Actual Load | ssj_ops | |
|---|---|---|---|
| Target | Actual | ||
| Calibration 1 | 935,462 | ||
| Calibration 2 | 935,244 | ||
| Calibration 3 | 932,544 | ||
| ssj_ops@calibrated=933,894 | |||
| 100% | 99.6% | 933,894 | 929,900 |
| 90% | 90.2% | 840,505 | 842,643 |
| 80% | 80.2% | 747,115 | 748,790 |
| 70% | 70.0% | 653,726 | 653,488 |
| 60% | 60.3% | 560,337 | 562,680 |
| 50% | 50.3% | 466,947 | 469,286 |
| 40% | 40.1% | 373,558 | 374,830 |
| 30% | 29.9% | 280,168 | 279,561 |
| 20% | 19.7% | 186,779 | 183,922 |
| 10% | 10.0% | 93,389 | 93,255 |
| Active Idle | 0 | 0 | |
| Set Identifier: | sut |
| Set Description: | PowerEdge M610 |
| # of Identical Nodes: | 16 |
| Comment: | None |
| Hardware | |
|---|---|
| Hardware Vendor: | Dell Inc. |
| Model: | PowerEdge M610 |
| Form Factor: | Blade |
| CPU Name: | Intel Xeon X5675 (3.06 GHz) |
| CPU Characteristics: | 6 Core, 3.06 GHz, 12 MB L3 Cache |
| CPU Frequency (MHz): | 3060 |
| CPU(s) Enabled: | 12 cores, 2 chips, 6 cores/chip |
| Hardware Threads: | 24 (2 / core) |
| CPU(s) Orderable: | 1,2 chips |
| Primary Cache: | 32 KB I + 32 KB D on chip per core |
| Secondary Cache: | 256 KB I+D on chip per core |
| Tertiary Cache: | 12 MB I+D on chip per chip |
| Other Cache: | None |
| Memory Amount (GB): | 24 |
| # and size of DIMM: | 6 x 4096 MB |
| Memory Details: | 4GB 2Rx8 PC3L-10600R ECC RDIMM, Slots A1, A2, A3, B1, B2, B3 populated |
| Power Supply Quantity and Rating (W): | None |
| Power Supply Details: | Shared |
| Disk Drive: | 1 x 50 GB 2.5" SSD SATA (Dell PN X2N7H) |
| Disk Controller: | Modular SATA Pass-Through |
| # and type of Network Interface Cards (NICs) Installed: | 1 x onboard dual-port 1 Gigabit Ethernet |
| NICs Enabled in Firmware / OS / Connected: | 2/2/1 |
| Network Speed (Mbit): | 1000 |
| Keyboard: | None |
| Mouse: | None |
| Monitor: | None |
| Optical Drives: | No |
| Other Hardware: | None |
| Software | |
|---|---|
| Power Management: | Power Saver Mode in OS (See Notes) |
| Operating System (OS): | Windows 2008 Server Enterprise x64 Edition |
| OS Version: | R2 SP1 |
| Filesystem: | NTFS |
| JVM Vendor: | Oracle Corporation |
| JVM Version: | Oracle Java HotSpot(TM) 64-Bit Server VM on Windows, version 1.6.0_27 |
| JVM Command-line Options: | -server -Xmx4g -Xms4g -Xmn3500m -XX:SurvivorRatio=55 -XX:TargetSurvivorRatio=90 -XX:ParallelGCThreads=12 -XX:AllocatePrefetchDistance=256 -XX:AllocatePrefetchLines=4 -XX:LoopUnrollLimit=45 -XX:InitialTenuringThreshold=12 -XX:MaxTenuringThreshold=15 -XX:InlineSmallCode=3900 -XX:MaxInlineSize=270 -XX:FreqInlineSize=2500 -XX:+UseLargePages -XX:+UseParallelOldGC -XX:+UseCompressedStrings -XX:+AggressiveOpts |
| JVM Affinity: | start /affinity [FFF, FFF000]] |
| JVM Instances: | 2 |
| JVM Initial Heap (MB): | 4096 |
| JVM Maximum Heap (MB): | 4096 |
| JVM Address Bits: | 64 |
| Boot Firmware Version: | 3.0.0 |
| Management Firmware Version: | iDRAC 3.21 build 48 |
| Workload Version: | SSJ 1.2.6 |
| Director Location: | Controller |
| Other Software: | None |
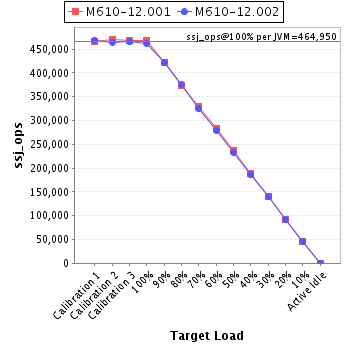
| JVM Instance | ssj_ops@100% |
|---|---|
| M610-12.001 | 467,838 |
| M610-12.002 | 462,061 |
| ssj_ops@100% | 929,900 |
| ssj_ops@100% per JVM | 464,950 |
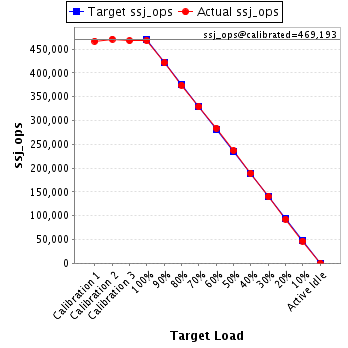
| Target Load | Actual Load | ssj_ops | |
|---|---|---|---|
| Target | Actual | ||
| Calibration 1 | 466,813 | ||
| Calibration 2 | 470,802 | ||
| Calibration 3 | 467,584 | ||
| ssj_ops@calibrated=469,193 | |||
| 100% | 99.7% | 469,193 | 467,838 |
| 90% | 89.8% | 422,274 | 421,386 |
| 80% | 79.7% | 375,354 | 373,912 |
| 70% | 70.1% | 328,435 | 328,987 |
| 60% | 60.5% | 281,516 | 283,931 |
| 50% | 50.5% | 234,597 | 236,841 |
| 40% | 40.3% | 187,677 | 189,174 |
| 30% | 29.9% | 140,758 | 140,290 |
| 20% | 19.8% | 93,839 | 92,732 |
| 10% | 9.9% | 46,919 | 46,675 |
| Active Idle | 0 | 0 | |
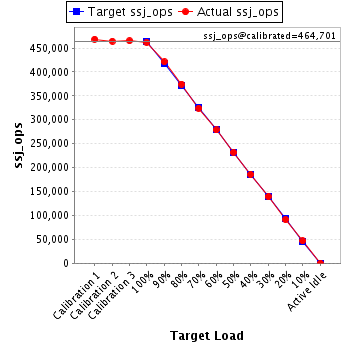
| Target Load | Actual Load | ssj_ops | |
|---|---|---|---|
| Target | Actual | ||
| Calibration 1 | 468,650 | ||
| Calibration 2 | 464,443 | ||
| Calibration 3 | 464,960 | ||
| ssj_ops@calibrated=464,701 | |||
| 100% | 99.4% | 464,701 | 462,061 |
| 90% | 90.7% | 418,231 | 421,256 |
| 80% | 80.7% | 371,761 | 374,878 |
| 70% | 69.8% | 325,291 | 324,501 |
| 60% | 60.0% | 278,821 | 278,750 |
| 50% | 50.0% | 232,351 | 232,445 |
| 40% | 40.0% | 185,880 | 185,656 |
| 30% | 30.0% | 139,410 | 139,271 |
| 20% | 19.6% | 92,940 | 91,190 |
| 10% | 10.0% | 46,470 | 46,580 |
| Active Idle | 0 | 0 | |