SPECpower_ssj2008
Host 'M610-11' Performance Report
Copyright © 2007-2011 Standard Performance Evaluation Corporation
| Dell Inc. PowerEdge M610 | ssj_ops@100% = 922,091 ssj_ops@100% per JVM = 461,046 |
||||
| Test Sponsor: | Dell Inc. | SPEC License #: | 55 | Test Method: | Multi Node |
| Tested By: | Dell Inc. | Test Location: | Round Rock, TX, USA | Test Date: | Sep 26, 2011 |
| Hardware Availability: | Feb-2011 | Software Availability: | Apr-2011 | Publication: | Nov 2, 2011 |
| System Source: | Single Supplier | System Designation: | Server | Power Provisioning: | Line-powered |
| Target Load | Actual Load | ssj_ops | |
|---|---|---|---|
| Target | Actual | ||
| Calibration 1 | 936,342 | ||
| Calibration 2 | 931,788 | ||
| Calibration 3 | 920,666 | ||
| ssj_ops@calibrated=926,227 | |||
| 100% | 99.6% | 926,227 | 922,091 |
| 90% | 90.1% | 833,604 | 834,534 |
| 80% | 79.7% | 740,982 | 738,474 |
| 70% | 70.1% | 648,359 | 648,863 |
| 60% | 59.9% | 555,736 | 554,374 |
| 50% | 50.0% | 463,113 | 462,655 |
| 40% | 39.9% | 370,491 | 369,885 |
| 30% | 30.1% | 277,868 | 279,029 |
| 20% | 20.0% | 185,245 | 185,288 |
| 10% | 10.0% | 92,623 | 92,794 |
| Active Idle | 0 | 0 | |

| Set Identifier: | sut |
| Set Description: | PowerEdge M610 |
| # of Identical Nodes: | 16 |
| Comment: | None |
| Hardware | |
|---|---|
| Hardware Vendor: | Dell Inc. |
| Model: | PowerEdge M610 |
| Form Factor: | Blade |
| CPU Name: | Intel Xeon X5675 (3.06 GHz) |
| CPU Characteristics: | 6 Core, 3.06 GHz, 12 MB L3 Cache |
| CPU Frequency (MHz): | 3060 |
| CPU(s) Enabled: | 12 cores, 2 chips, 6 cores/chip |
| Hardware Threads: | 24 (2 / core) |
| CPU(s) Orderable: | 1,2 chips |
| Primary Cache: | 32 KB I + 32 KB D on chip per core |
| Secondary Cache: | 256 KB I+D on chip per core |
| Tertiary Cache: | 12 MB I+D on chip per chip |
| Other Cache: | None |
| Memory Amount (GB): | 24 |
| # and size of DIMM: | 6 x 4096 MB |
| Memory Details: | 4GB 2Rx8 PC3L-10600R ECC RDIMM, Slots A1, A2, A3, B1, B2, B3 populated |
| Power Supply Quantity and Rating (W): | None |
| Power Supply Details: | Shared |
| Disk Drive: | 1 x 50 GB 2.5" SSD SATA (Dell PN X2N7H) |
| Disk Controller: | Modular SATA Pass-Through |
| # and type of Network Interface Cards (NICs) Installed: | 1 x onboard dual-port 1 Gigabit Ethernet |
| NICs Enabled in Firmware / OS / Connected: | 2/2/1 |
| Network Speed (Mbit): | 1000 |
| Keyboard: | None |
| Mouse: | None |
| Monitor: | None |
| Optical Drives: | No |
| Other Hardware: | None |
| Software | |
|---|---|
| Power Management: | Power Saver Mode in OS (See Notes) |
| Operating System (OS): | Windows 2008 Server Enterprise x64 Edition |
| OS Version: | R2 SP1 |
| Filesystem: | NTFS |
| JVM Vendor: | Oracle Corporation |
| JVM Version: | Oracle Java HotSpot(TM) 64-Bit Server VM on Windows, version 1.6.0_27 |
| JVM Command-line Options: | -server -Xmx4g -Xms4g -Xmn3500m -XX:SurvivorRatio=55 -XX:TargetSurvivorRatio=90 -XX:ParallelGCThreads=12 -XX:AllocatePrefetchDistance=256 -XX:AllocatePrefetchLines=4 -XX:LoopUnrollLimit=45 -XX:InitialTenuringThreshold=12 -XX:MaxTenuringThreshold=15 -XX:InlineSmallCode=3900 -XX:MaxInlineSize=270 -XX:FreqInlineSize=2500 -XX:+UseLargePages -XX:+UseParallelOldGC -XX:+UseCompressedStrings -XX:+AggressiveOpts |
| JVM Affinity: | start /affinity [FFF, FFF000]] |
| JVM Instances: | 2 |
| JVM Initial Heap (MB): | 4096 |
| JVM Maximum Heap (MB): | 4096 |
| JVM Address Bits: | 64 |
| Boot Firmware Version: | 3.0.0 |
| Management Firmware Version: | iDRAC 3.21 build 48 |
| Workload Version: | SSJ 1.2.6 |
| Director Location: | Controller |
| Other Software: | None |
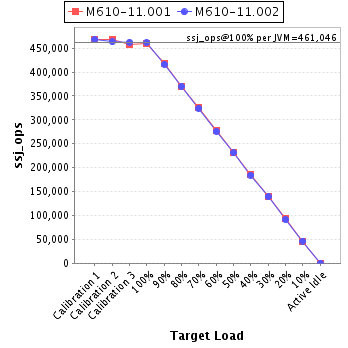
| JVM Instance | ssj_ops@100% |
|---|---|
| M610-11.001 | 460,401 |
| M610-11.002 | 461,690 |
| ssj_ops@100% | 922,091 |
| ssj_ops@100% per JVM | 461,046 |
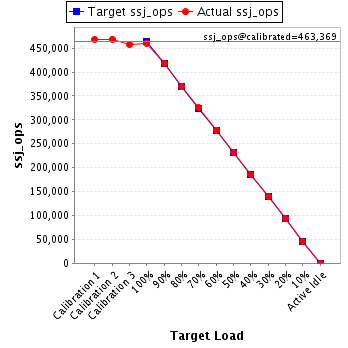
| Target Load | Actual Load | ssj_ops | |
|---|---|---|---|
| Target | Actual | ||
| Calibration 1 | 467,911 | ||
| Calibration 2 | 468,775 | ||
| Calibration 3 | 457,963 | ||
| ssj_ops@calibrated=463,369 | |||
| 100% | 99.4% | 463,369 | 460,401 |
| 90% | 90.3% | 417,032 | 418,475 |
| 80% | 79.6% | 370,695 | 368,801 |
| 70% | 70.1% | 324,358 | 324,869 |
| 60% | 60.1% | 278,021 | 278,649 |
| 50% | 50.0% | 231,684 | 231,754 |
| 40% | 40.0% | 185,348 | 185,401 |
| 30% | 30.2% | 139,011 | 140,021 |
| 20% | 20.2% | 92,674 | 93,437 |
| 10% | 10.0% | 46,337 | 46,278 |
| Active Idle | 0 | 0 | |
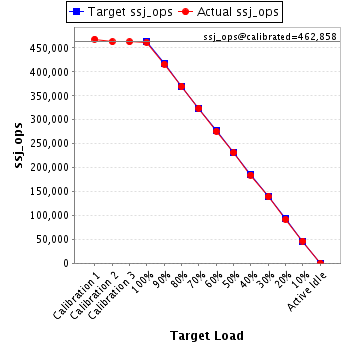
| Target Load | Actual Load | ssj_ops | |
|---|---|---|---|
| Target | Actual | ||
| Calibration 1 | 468,431 | ||
| Calibration 2 | 463,013 | ||
| Calibration 3 | 462,703 | ||
| ssj_ops@calibrated=462,858 | |||
| 100% | 99.7% | 462,858 | 461,690 |
| 90% | 89.9% | 416,572 | 416,059 |
| 80% | 79.9% | 370,286 | 369,673 |
| 70% | 70.0% | 324,001 | 323,995 |
| 60% | 59.6% | 277,715 | 275,725 |
| 50% | 49.9% | 231,429 | 230,901 |
| 40% | 39.9% | 185,143 | 184,484 |
| 30% | 30.0% | 138,857 | 139,008 |
| 20% | 19.8% | 92,572 | 91,851 |
| 10% | 10.0% | 46,286 | 46,516 |
| Active Idle | 0 | 0 | |