SPECpower_ssj2008
Host 'm915-4' Performance Report
Copyright © 2007-2011 Standard Performance Evaluation Corporation
| Dell Inc. PowerEdge M915 | ssj_ops@100% = 1,837,949 ssj_ops@100% per JVM = 229,744 |
||||
| Test Sponsor: | Dell Inc. | SPEC License #: | 55 | Test Method: | Multi Node |
| Tested By: | Dell Inc. | Test Location: | Round Rock, TX, USA | Test Date: | Jun 28, 2011 |
| Hardware Availability: | Jun-2011 | Software Availability: | Feb-2011 | Publication: | Aug 2, 2011 |
| System Source: | Single Supplier | System Designation: | Server | Power Provisioning: | Line-powered |
| Target Load | Actual Load | ssj_ops | |
|---|---|---|---|
| Target | Actual | ||
| Calibration 1 | 1,849,801 | ||
| Calibration 2 | 1,850,614 | ||
| Calibration 3 | 1,847,870 | ||
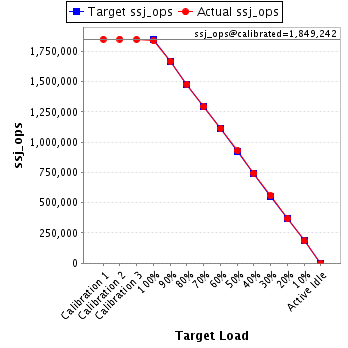
| ssj_ops@calibrated=1,849,242 | |||
| 100% | 99.4% | 1,849,242 | 1,837,949 |
| 90% | 90.2% | 1,664,318 | 1,667,809 |
| 80% | 80.0% | 1,479,393 | 1,478,794 |
| 70% | 69.9% | 1,294,469 | 1,292,581 |
| 60% | 60.1% | 1,109,545 | 1,111,287 |
| 50% | 50.2% | 924,621 | 927,870 |
| 40% | 40.3% | 739,697 | 744,320 |
| 30% | 30.0% | 554,773 | 555,505 |
| 20% | 19.9% | 369,848 | 367,475 |
| 10% | 10.0% | 184,924 | 184,703 |
| Active Idle | 0 | 0 | |
| Set Identifier: | sut |
| Set Description: | PowerEdge M915 |
| # of Identical Nodes: | 8 |
| Comment: | None |
| Hardware | |
|---|---|
| Hardware Vendor: | Dell Inc. |
| Model: | PowerEdge M915 |
| Form Factor: | Blade |
| CPU Name: | AMD Opteron 6176 (2.30 GHz) |
| CPU Characteristics: | 12 Core, 2.30 GHz, 12 MB L3 Cache |
| CPU Frequency (MHz): | 2300 |
| CPU(s) Enabled: | 48 cores, 4 chips, 12 cores/chip |
| Hardware Threads: | 48 (1 / core) |
| CPU(s) Orderable: | 2,4 chips |
| Primary Cache: | 64 KB I + 64 KB D on chip per core |
| Secondary Cache: | 512 KB I+D on chip per core |
| Tertiary Cache: | 12 MB I+D on chip per chip, 6MB shared / 6 cores |
| Other Cache: | None |
| Memory Amount (GB): | 32 |
| # and size of DIMM: | 16 x 2048 MB |
| Memory Details: | 2GB 1Rx8 PC3L-10600R ECC RDIMM, Slots A1-A4, B1-B4, C1-C4, D1-D4 populated |
| Power Supply Quantity and Rating (W): | None |
| Power Supply Details: | N/A |
| Disk Drive: | 1 x 50 GB 2.5" SSD P/N X2N7H |
| Disk Controller: | PERC H200 Modular |
| # and type of Network Interface Cards (NICs) Installed: | 2 x onboard dual-port 1 Gigabit Ethernet |
| NICs Enabled in Firmware / OS / Connected: | 2/2/1 |
| Network Speed (Mbit): | 1000 |
| Keyboard: | None |
| Mouse: | None |
| Monitor: | None |
| Optical Drives: | No |
| Other Hardware: | None |
| Software | |
|---|---|
| Power Management: | Balanced Mode in OS (See Notes) |
| Operating System (OS): | Windows 2008 Server Enterprise x64 Edition |
| OS Version: | R2 SP1 |
| Filesystem: | NTFS |
| JVM Vendor: | IBM Corporation |
| JVM Version: | IBM J9 VM (build 2.4, J2RE 1.6.0 IBM J9 2.4 Windows Server 2008 amd64-64 jvmwa64 60sr5-20090519_35743 (JIT enabled, AOT enabled) |
| JVM Command-line Options: | -Xaggressive -Xcompressedrefs -Xgcpolicy:gencon -Xmn1400m -Xms1875m -Xmx1875m -XlockReservation -Xnoloa -XtlhPrefetch -Xlp |
| JVM Affinity: | start /affinity [3F, FC0, 3F000, FC0000, 3F000000, FC0000000, 3F000000000, FC0000000000] |
| JVM Instances: | 8 |
| JVM Initial Heap (MB): | 1875 |
| JVM Maximum Heap (MB): | 1875 |
| JVM Address Bits: | 64 |
| Boot Firmware Version: | 1.0.3 |
| Management Firmware Version: | iDRAC 3.21 build 48 |
| Workload Version: | SSJ 1.2.6 |
| Director Location: | Controller |
| Other Software: | IBM WebSphere Application Server |
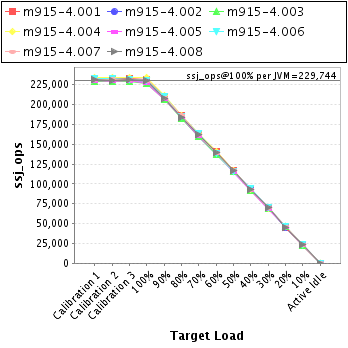
| JVM Instance | ssj_ops@100% |
|---|---|
| m915-4.001 | 231,014 |
| m915-4.002 | 229,187 |
| m915-4.003 | 227,020 |
| m915-4.004 | 234,408 |
| m915-4.005 | 226,962 |
| m915-4.006 | 230,346 |
| m915-4.007 | 229,341 |
| m915-4.008 | 229,671 |
| ssj_ops@100% | 1,837,949 |
| ssj_ops@100% per JVM | 229,744 |
| Target Load | Actual Load | ssj_ops | |
|---|---|---|---|
| Target | Actual | ||
| Calibration 1 | 232,720 | ||
| Calibration 2 | 232,919 | ||
| Calibration 3 | 232,216 | ||
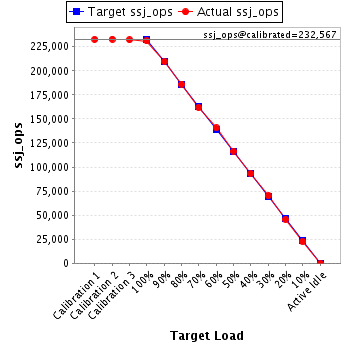
| ssj_ops@calibrated=232,567 | |||
| 100% | 99.3% | 232,567 | 231,014 |
| 90% | 90.2% | 209,311 | 209,751 |
| 80% | 80.0% | 186,054 | 186,147 |
| 70% | 69.7% | 162,797 | 162,157 |
| 60% | 60.5% | 139,540 | 140,730 |
| 50% | 50.1% | 116,284 | 116,559 |
| 40% | 40.0% | 93,027 | 93,003 |
| 30% | 30.1% | 69,770 | 70,044 |
| 20% | 19.6% | 46,513 | 45,625 |
| 10% | 9.8% | 23,257 | 22,684 |
| Active Idle | 0 | 0 | |
| Target Load | Actual Load | ssj_ops | |
|---|---|---|---|
| Target | Actual | ||
| Calibration 1 | 230,740 | ||
| Calibration 2 | 230,618 | ||
| Calibration 3 | 230,044 | ||
| ssj_ops@calibrated=230,331 | |||
| 100% | 99.5% | 230,331 | 229,187 |
| 90% | 89.9% | 207,298 | 207,104 |
| 80% | 79.8% | 184,265 | 183,693 |
| 70% | 69.3% | 161,232 | 159,554 |
| 60% | 59.6% | 138,199 | 137,214 |
| 50% | 50.2% | 115,166 | 115,613 |
| 40% | 40.7% | 92,132 | 93,670 |
| 30% | 29.8% | 69,099 | 68,649 |
| 20% | 19.8% | 46,066 | 45,635 |
| 10% | 10.1% | 23,033 | 23,300 |
| Active Idle | 0 | 0 | |

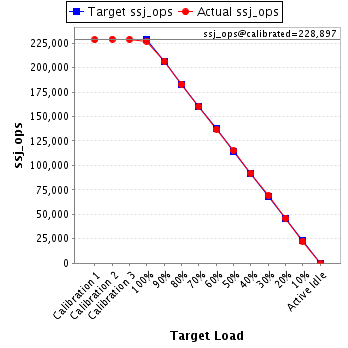
| Target Load | Actual Load | ssj_ops | |
|---|---|---|---|
| Target | Actual | ||
| Calibration 1 | 228,400 | ||
| Calibration 2 | 229,034 | ||
| Calibration 3 | 228,759 | ||
| ssj_ops@calibrated=228,897 | |||
| 100% | 99.2% | 228,897 | 227,020 |
| 90% | 90.2% | 206,007 | 206,472 |
| 80% | 79.9% | 183,117 | 182,975 |
| 70% | 70.0% | 160,228 | 160,204 |
| 60% | 59.9% | 137,338 | 137,159 |
| 50% | 50.3% | 114,448 | 115,142 |
| 40% | 40.3% | 91,559 | 92,226 |
| 30% | 30.1% | 68,669 | 68,896 |
| 20% | 20.1% | 45,779 | 46,099 |
| 10% | 9.9% | 22,890 | 22,694 |
| Active Idle | 0 | 0 | |
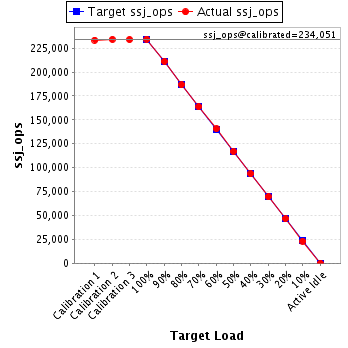
| Target Load | Actual Load | ssj_ops | |
|---|---|---|---|
| Target | Actual | ||
| Calibration 1 | 233,511 | ||
| Calibration 2 | 234,190 | ||
| Calibration 3 | 233,913 | ||
| ssj_ops@calibrated=234,051 | |||
| 100% | 100.2% | 234,051 | 234,408 |
| 90% | 90.2% | 210,646 | 211,230 |
| 80% | 79.7% | 187,241 | 186,627 |
| 70% | 70.0% | 163,836 | 163,742 |
| 60% | 60.1% | 140,431 | 140,711 |
| 50% | 50.1% | 117,026 | 117,229 |
| 40% | 39.9% | 93,621 | 93,457 |
| 30% | 29.7% | 70,215 | 69,557 |
| 20% | 19.9% | 46,810 | 46,609 |
| 10% | 9.9% | 23,405 | 23,210 |
| Active Idle | 0 | 0 | |
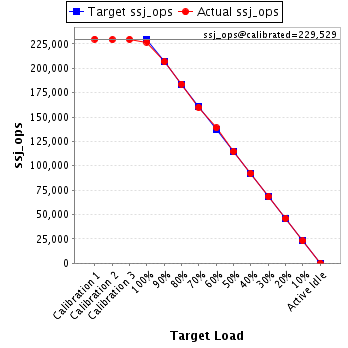
| Target Load | Actual Load | ssj_ops | |
|---|---|---|---|
| Target | Actual | ||
| Calibration 1 | 229,934 | ||
| Calibration 2 | 229,396 | ||
| Calibration 3 | 229,663 | ||
| ssj_ops@calibrated=229,529 | |||
| 100% | 98.9% | 229,529 | 226,962 |
| 90% | 90.1% | 206,576 | 206,899 |
| 80% | 80.1% | 183,624 | 183,895 |
| 70% | 69.7% | 160,671 | 159,963 |
| 60% | 60.6% | 137,718 | 139,003 |
| 50% | 50.0% | 114,765 | 114,667 |
| 40% | 40.1% | 91,812 | 92,052 |
| 30% | 29.8% | 68,859 | 68,345 |
| 20% | 20.1% | 45,906 | 46,082 |
| 10% | 10.0% | 22,953 | 22,911 |
| Active Idle | 0 | 0 | |
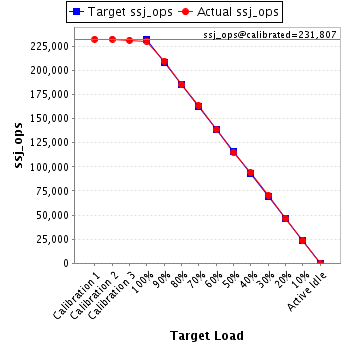
| Target Load | Actual Load | ssj_ops | |
|---|---|---|---|
| Target | Actual | ||
| Calibration 1 | 232,334 | ||
| Calibration 2 | 232,396 | ||
| Calibration 3 | 231,218 | ||
| ssj_ops@calibrated=231,807 | |||
| 100% | 99.4% | 231,807 | 230,346 |
| 90% | 90.4% | 208,626 | 209,540 |
| 80% | 79.8% | 185,446 | 185,064 |
| 70% | 70.5% | 162,265 | 163,360 |
| 60% | 59.8% | 139,084 | 138,570 |
| 50% | 49.7% | 115,904 | 115,309 |
| 40% | 40.5% | 92,723 | 93,776 |
| 30% | 30.3% | 69,542 | 70,236 |
| 20% | 20.0% | 46,361 | 46,317 |
| 10% | 10.1% | 23,181 | 23,460 |
| Active Idle | 0 | 0 | |
| Target Load | Actual Load | ssj_ops | |
|---|---|---|---|
| Target | Actual | ||
| Calibration 1 | 230,957 | ||
| Calibration 2 | 231,567 | ||
| Calibration 3 | 231,024 | ||
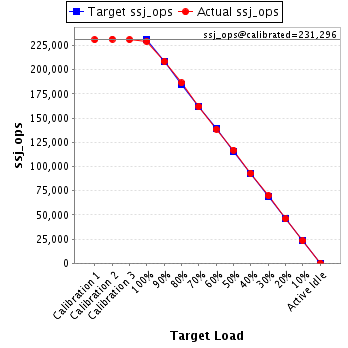
| ssj_ops@calibrated=231,296 | |||
| 100% | 99.2% | 231,296 | 229,341 |
| 90% | 90.2% | 208,166 | 208,651 |
| 80% | 80.5% | 185,036 | 186,300 |
| 70% | 70.0% | 161,907 | 161,934 |
| 60% | 59.9% | 138,777 | 138,587 |
| 50% | 50.6% | 115,648 | 116,933 |
| 40% | 40.1% | 92,518 | 92,827 |
| 30% | 30.2% | 69,389 | 69,819 |
| 20% | 19.8% | 46,259 | 45,831 |
| 10% | 10.1% | 23,130 | 23,306 |
| Active Idle | 0 | 0 | |
| Target Load | Actual Load | ssj_ops | |
|---|---|---|---|
| Target | Actual | ||
| Calibration 1 | 231,204 | ||
| Calibration 2 | 230,495 | ||
| Calibration 3 | 231,032 | ||
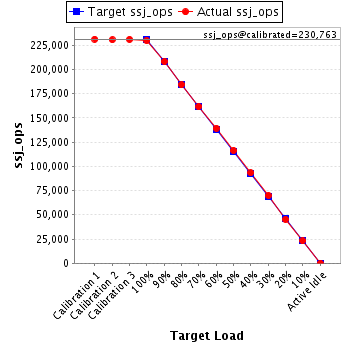
| ssj_ops@calibrated=230,763 | |||
| 100% | 99.5% | 230,763 | 229,671 |
| 90% | 90.2% | 207,687 | 208,162 |
| 80% | 79.8% | 184,611 | 184,093 |
| 70% | 70.1% | 161,534 | 161,667 |
| 60% | 60.4% | 138,458 | 139,314 |
| 50% | 50.4% | 115,382 | 116,419 |
| 40% | 40.4% | 92,305 | 93,309 |
| 30% | 30.3% | 69,229 | 69,959 |
| 20% | 19.6% | 46,153 | 45,277 |
| 10% | 10.0% | 23,076 | 23,138 |
| Active Idle | 0 | 0 | |