SPECpower_ssj2008
Host 'WIN-UENIRSNOORB' Performance Report
Copyright © 2007-2011 Standard Performance Evaluation Corporation
| Hitachi, Ltd. BS2000 Server Blade E55A2 | ssj_ops@100% = 934,062 ssj_ops@100% per JVM = 155,677 |
||||
| Test Sponsor: | Hitachi, Ltd. | SPEC License #: | 35 | Test Method: | Multi Node |
| Tested By: | Hitachi, Ltd. | Test Location: | Hadano, Kanagawa, Japan | Test Date: | Feb 20, 2011 |
| Hardware Availability: | Feb-2011 | Software Availability: | Jun-2010 | Publication: | Mar 9, 2011 |
| System Source: | Single Supplier | System Designation: | Server | Power Provisioning: | Line-powered |
| Target Load | Actual Load | ssj_ops | |
|---|---|---|---|
| Target | Actual | ||
| Calibration 1 | 936,721 | ||
| Calibration 2 | 937,130 | ||
| Calibration 3 | 938,484 | ||
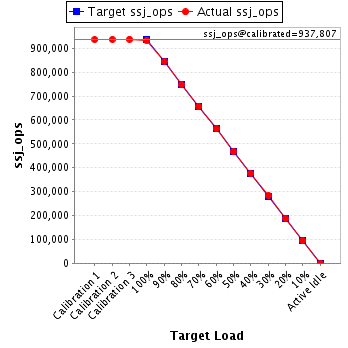
| ssj_ops@calibrated=937,807 | |||
| 100% | 99.6% | 937,807 | 934,062 |
| 90% | 90.0% | 844,026 | 844,264 |
| 80% | 79.7% | 750,245 | 747,354 |
| 70% | 70.2% | 656,465 | 658,256 |
| 60% | 60.1% | 562,684 | 563,186 |
| 50% | 50.0% | 468,903 | 468,678 |
| 40% | 40.2% | 375,123 | 376,831 |
| 30% | 30.2% | 281,342 | 283,589 |
| 20% | 19.9% | 187,561 | 186,539 |
| 10% | 10.0% | 93,781 | 93,862 |
| Active Idle | 0 | 0 | |
| Set Identifier: | sut |
| Set Description: | System Under Test |
| # of Identical Nodes: | 8 |
| Comment: | None |
| Hardware | |
|---|---|
| Hardware Vendor: | Hitachi, Ltd. |
| Model: | BS2000 Server Blade E55A2 |
| Form Factor: | Blade |
| CPU Name: | Intel Xeon X5675 |
| CPU Characteristics: | Six Core, 3.06GHz, 12MB L3 Cache |
| CPU Frequency (MHz): | 3067 |
| CPU(s) Enabled: | 12 cores, 2 chips, 6 cores/chip |
| Hardware Threads: | 24 (2 / core) |
| CPU(s) Orderable: | 1,2 chips |
| Primary Cache: | 32 KB I + 32 KB D on chip per core |
| Secondary Cache: | 256 KB I+D on chip per core |
| Tertiary Cache: | 12 MB I+D on chip per chip |
| Other Cache: | None |
| Memory Amount (GB): | 24 |
| # and size of DIMM: | 6 x 4096 MB |
| Memory Details: | 4GB 2Rx4 PC3L-10600R ECC CL9; slots A0, B0, C0, D0, E0 and F0 populated |
| Power Supply Quantity and Rating (W): | None |
| Power Supply Details: | Shared |
| Disk Drive: | 2 x 147GB 10K rpm 6Gbps SAS 2.5 (Hitachi P/N:GV-UH21472N1) |
| Disk Controller: | Integrated SAS controller |
| # and type of Network Interface Cards (NICs) Installed: | 1 x Intel 82576EB Gigabit Network Connection (onboard) |
| NICs Enabled in Firmware / OS / Connected: | 1/1/1 |
| Network Speed (Mbit): | 1000 |
| Keyboard: | None |
| Mouse: | None |
| Monitor: | None |
| Optical Drives: | No |
| Other Hardware: | None |
| Software | |
|---|---|
| Power Management: | Enabled (Power saver) |
| Operating System (OS): | Microsoft Windows Server 2008 R2 Enterprise |
| OS Version: | R2 |
| Filesystem: | NTFS |
| JVM Vendor: | IBM Corporation |
| JVM Version: | IBM J9 VM (build 2.4, JRE 1.6.0 IBM J9 2.4 Windows Server 2008 amd64-64 jvmwa6460sr7-20100219_54049)(JIT enabled, AOT enabled) |
| JVM Command-line Options: | -Xaggressive -Xcompressedrefs -Xgcpolicy:gencon -Xmn1500m -Xms1875m -Xmx1875m -XlockReservation -Xnoloa -XtlhPrefetch -Xlp |
| JVM Affinity: | start /affinity [F,F0,F00,F000,F0000,F00000] |
| JVM Instances: | 6 |
| JVM Initial Heap (MB): | 1875 |
| JVM Maximum Heap (MB): | 1875 |
| JVM Address Bits: | 64 |
| Boot Firmware Version: | 03-48 |
| Management Firmware Version: | 03-89 |
| Workload Version: | SSJ 1.2.6 |
| Director Location: | Controller |
| Other Software: | IBM WebSphere Application Server V7.0 for Windows on x86-64 bit |
| JVM Instance | ssj_ops@100% |
|---|---|
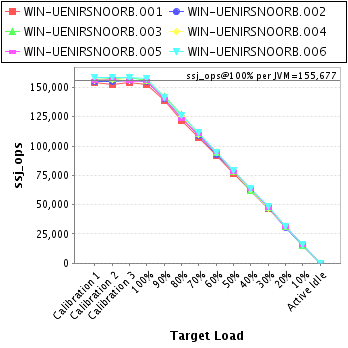
| WIN-UENIRSNOORB.001 | 152,669 |
| WIN-UENIRSNOORB.002 | 155,335 |
| WIN-UENIRSNOORB.003 | 156,252 |
| WIN-UENIRSNOORB.004 | 155,983 |
| WIN-UENIRSNOORB.005 | 155,958 |
| WIN-UENIRSNOORB.006 | 157,866 |
| ssj_ops@100% | 934,062 |
| ssj_ops@100% per JVM | 155,677 |
| Target Load | Actual Load | ssj_ops | |
|---|---|---|---|
| Target | Actual | ||
| Calibration 1 | 154,353 | ||
| Calibration 2 | 152,328 | ||
| Calibration 3 | 153,963 | ||
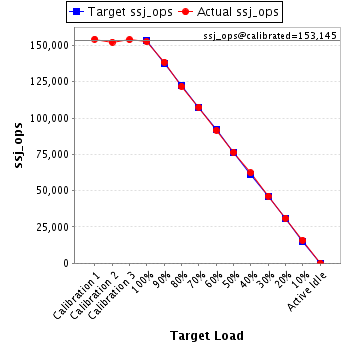
| ssj_ops@calibrated=153,145 | |||
| 100% | 99.7% | 153,145 | 152,669 |
| 90% | 90.5% | 137,831 | 138,547 |
| 80% | 79.5% | 122,516 | 121,790 |
| 70% | 70.2% | 107,202 | 107,521 |
| 60% | 59.8% | 91,887 | 91,594 |
| 50% | 50.0% | 76,573 | 76,562 |
| 40% | 40.6% | 61,258 | 62,235 |
| 30% | 30.2% | 45,944 | 46,323 |
| 20% | 20.3% | 30,629 | 31,058 |
| 10% | 10.3% | 15,315 | 15,845 |
| Active Idle | 0 | 0 | |
| Target Load | Actual Load | ssj_ops | |
|---|---|---|---|
| Target | Actual | ||
| Calibration 1 | 154,789 | ||
| Calibration 2 | 155,251 | ||
| Calibration 3 | 156,043 | ||
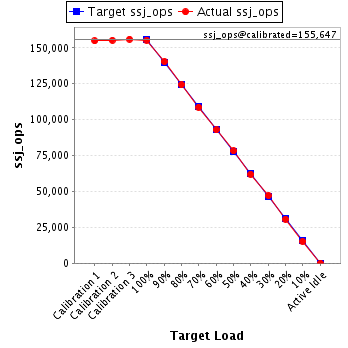
| ssj_ops@calibrated=155,647 | |||
| 100% | 99.8% | 155,647 | 155,335 |
| 90% | 90.2% | 140,082 | 140,372 |
| 80% | 79.8% | 124,518 | 124,186 |
| 70% | 69.9% | 108,953 | 108,730 |
| 60% | 59.7% | 93,388 | 92,917 |
| 50% | 50.2% | 77,824 | 78,177 |
| 40% | 39.8% | 62,259 | 61,995 |
| 30% | 30.3% | 46,694 | 47,094 |
| 20% | 19.8% | 31,129 | 30,773 |
| 10% | 9.8% | 15,565 | 15,258 |
| Active Idle | 0 | 0 | |
| Target Load | Actual Load | ssj_ops | |
|---|---|---|---|
| Target | Actual | ||
| Calibration 1 | 157,221 | ||
| Calibration 2 | 157,333 | ||
| Calibration 3 | 158,605 | ||
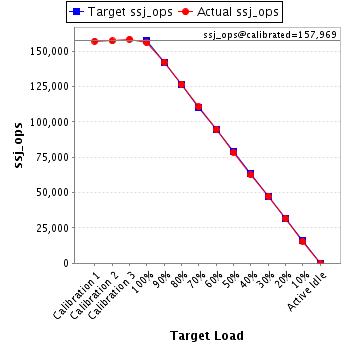
| ssj_ops@calibrated=157,969 | |||
| 100% | 98.9% | 157,969 | 156,252 |
| 90% | 90.1% | 142,172 | 142,258 |
| 80% | 80.2% | 126,375 | 126,624 |
| 70% | 70.0% | 110,578 | 110,636 |
| 60% | 60.0% | 94,781 | 94,819 |
| 50% | 49.8% | 78,985 | 78,611 |
| 40% | 39.6% | 63,188 | 62,483 |
| 30% | 30.0% | 47,391 | 47,380 |
| 20% | 19.9% | 31,594 | 31,412 |
| 10% | 9.8% | 15,797 | 15,540 |
| Active Idle | 0 | 0 | |
| Target Load | Actual Load | ssj_ops | |
|---|---|---|---|
| Target | Actual | ||
| Calibration 1 | 155,993 | ||
| Calibration 2 | 156,778 | ||
| Calibration 3 | 156,348 | ||
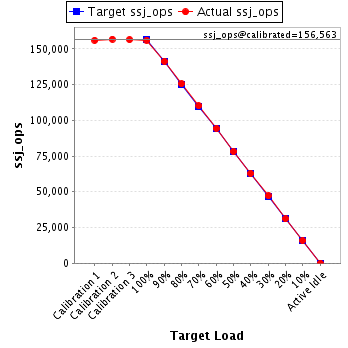
| ssj_ops@calibrated=156,563 | |||
| 100% | 99.6% | 156,563 | 155,983 |
| 90% | 90.3% | 140,907 | 141,306 |
| 80% | 80.1% | 125,250 | 125,470 |
| 70% | 70.3% | 109,594 | 110,069 |
| 60% | 60.3% | 93,938 | 94,390 |
| 50% | 50.0% | 78,281 | 78,250 |
| 40% | 40.1% | 62,625 | 62,847 |
| 30% | 30.1% | 46,969 | 47,125 |
| 20% | 19.8% | 31,313 | 31,015 |
| 10% | 10.2% | 15,656 | 15,936 |
| Active Idle | 0 | 0 | |
| Target Load | Actual Load | ssj_ops | |
|---|---|---|---|
| Target | Actual | ||
| Calibration 1 | 155,583 | ||
| Calibration 2 | 156,897 | ||
| Calibration 3 | 155,222 | ||
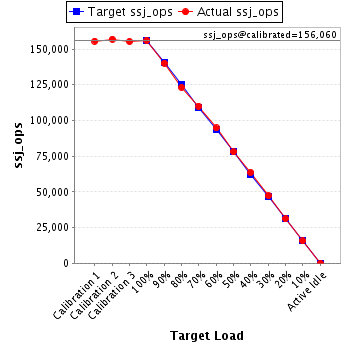
| ssj_ops@calibrated=156,060 | |||
| 100% | 99.9% | 156,060 | 155,958 |
| 90% | 89.8% | 140,454 | 140,132 |
| 80% | 79.0% | 124,848 | 123,254 |
| 70% | 70.5% | 109,242 | 110,061 |
| 60% | 60.7% | 93,636 | 94,706 |
| 50% | 49.9% | 78,030 | 77,930 |
| 40% | 40.8% | 62,424 | 63,665 |
| 30% | 30.3% | 46,818 | 47,217 |
| 20% | 19.9% | 31,212 | 31,112 |
| 10% | 10.0% | 15,606 | 15,611 |
| Active Idle | 0 | 0 | |
| Target Load | Actual Load | ssj_ops | |
|---|---|---|---|
| Target | Actual | ||
| Calibration 1 | 158,783 | ||
| Calibration 2 | 158,542 | ||
| Calibration 3 | 158,303 | ||
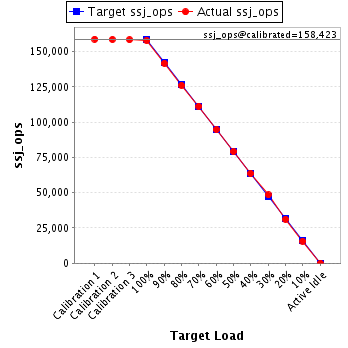
| ssj_ops@calibrated=158,423 | |||
| 100% | 99.6% | 158,423 | 157,866 |
| 90% | 89.4% | 142,581 | 141,650 |
| 80% | 79.6% | 126,738 | 126,031 |
| 70% | 70.2% | 110,896 | 111,240 |
| 60% | 59.8% | 95,054 | 94,759 |
| 50% | 50.0% | 79,211 | 79,148 |
| 40% | 40.1% | 63,369 | 63,606 |
| 30% | 30.6% | 47,527 | 48,449 |
| 20% | 19.7% | 31,685 | 31,168 |
| 10% | 9.9% | 15,842 | 15,672 |
| Active Idle | 0 | 0 | |