
SPECpower_ssj2008
Host 'WIN-N6VV5TJFAF6' Performance Report
Copyright © 2007-2011 Standard Performance Evaluation Corporation
| Hitachi, Ltd. BS2000 Server Blade E55A2 | ssj_ops@100% = 932,284 ssj_ops@100% per JVM = 155,381 |
||||
| Test Sponsor: | Hitachi, Ltd. | SPEC License #: | 35 | Test Method: | Multi Node |
| Tested By: | Hitachi, Ltd. | Test Location: | Hadano, Kanagawa, Japan | Test Date: | Feb 20, 2011 |
| Hardware Availability: | Feb-2011 | Software Availability: | Jun-2010 | Publication: | Mar 9, 2011 |
| System Source: | Single Supplier | System Designation: | Server | Power Provisioning: | Line-powered |
| Target Load | Actual Load | ssj_ops | |
|---|---|---|---|
| Target | Actual | ||
| Calibration 1 | 939,150 | ||
| Calibration 2 | 934,481 | ||
| Calibration 3 | 935,244 | ||
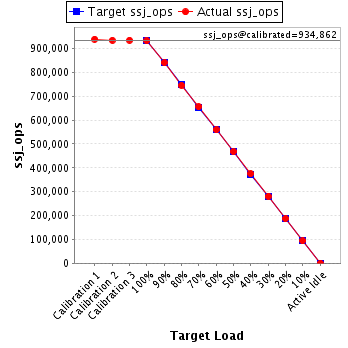
| ssj_ops@calibrated=934,862 | |||
| 100% | 99.7% | 934,862 | 932,284 |
| 90% | 89.9% | 841,376 | 840,822 |
| 80% | 79.7% | 747,890 | 745,404 |
| 70% | 70.2% | 654,404 | 656,111 |
| 60% | 59.9% | 560,917 | 559,742 |
| 50% | 50.0% | 467,431 | 467,878 |
| 40% | 40.1% | 373,945 | 375,082 |
| 30% | 30.0% | 280,459 | 280,669 |
| 20% | 20.0% | 186,972 | 187,013 |
| 10% | 10.0% | 93,486 | 93,942 |
| Active Idle | 0 | 0 | |
| Set Identifier: | sut |
| Set Description: | System Under Test |
| # of Identical Nodes: | 8 |
| Comment: | None |
| Hardware | |
|---|---|
| Hardware Vendor: | Hitachi, Ltd. |
| Model: | BS2000 Server Blade E55A2 |
| Form Factor: | Blade |
| CPU Name: | Intel Xeon X5675 |
| CPU Characteristics: | Six Core, 3.06GHz, 12MB L3 Cache |
| CPU Frequency (MHz): | 3067 |
| CPU(s) Enabled: | 12 cores, 2 chips, 6 cores/chip |
| Hardware Threads: | 24 (2 / core) |
| CPU(s) Orderable: | 1,2 chips |
| Primary Cache: | 32 KB I + 32 KB D on chip per core |
| Secondary Cache: | 256 KB I+D on chip per core |
| Tertiary Cache: | 12 MB I+D on chip per chip |
| Other Cache: | None |
| Memory Amount (GB): | 24 |
| # and size of DIMM: | 6 x 4096 MB |
| Memory Details: | 4GB 2Rx4 PC3L-10600R ECC CL9; slots A0, B0, C0, D0, E0 and F0 populated |
| Power Supply Quantity and Rating (W): | None |
| Power Supply Details: | Shared |
| Disk Drive: | 2 x 147GB 10K rpm 6Gbps SAS 2.5 (Hitachi P/N:GV-UH21472N1) |
| Disk Controller: | Integrated SAS controller |
| # and type of Network Interface Cards (NICs) Installed: | 1 x Intel 82576EB Gigabit Network Connection (onboard) |
| NICs Enabled in Firmware / OS / Connected: | 1/1/1 |
| Network Speed (Mbit): | 1000 |
| Keyboard: | None |
| Mouse: | None |
| Monitor: | None |
| Optical Drives: | No |
| Other Hardware: | None |
| Software | |
|---|---|
| Power Management: | Enabled (Power saver) |
| Operating System (OS): | Microsoft Windows Server 2008 R2 Enterprise |
| OS Version: | R2 |
| Filesystem: | NTFS |
| JVM Vendor: | IBM Corporation |
| JVM Version: | IBM J9 VM (build 2.4, JRE 1.6.0 IBM J9 2.4 Windows Server 2008 amd64-64 jvmwa6460sr7-20100219_54049)(JIT enabled, AOT enabled) |
| JVM Command-line Options: | -Xaggressive -Xcompressedrefs -Xgcpolicy:gencon -Xmn1500m -Xms1875m -Xmx1875m -XlockReservation -Xnoloa -XtlhPrefetch -Xlp |
| JVM Affinity: | start /affinity [F,F0,F00,F000,F0000,F00000] |
| JVM Instances: | 6 |
| JVM Initial Heap (MB): | 1875 |
| JVM Maximum Heap (MB): | 1875 |
| JVM Address Bits: | 64 |
| Boot Firmware Version: | 03-48 |
| Management Firmware Version: | 03-89 |
| Workload Version: | SSJ 1.2.6 |
| Director Location: | Controller |
| Other Software: | IBM WebSphere Application Server V7.0 for Windows on x86-64 bit |
| JVM Instance | ssj_ops@100% |
|---|---|
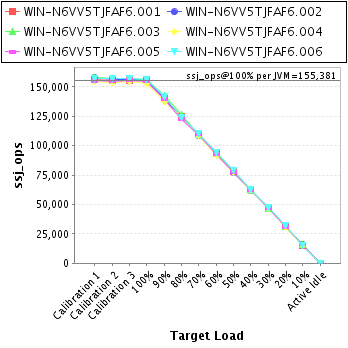
| WIN-N6VV5TJFAF6.001 | 155,392 |
| WIN-N6VV5TJFAF6.002 | 156,107 |
| WIN-N6VV5TJFAF6.003 | 156,659 |
| WIN-N6VV5TJFAF6.004 | 153,036 |
| WIN-N6VV5TJFAF6.005 | 154,818 |
| WIN-N6VV5TJFAF6.006 | 156,271 |
| ssj_ops@100% | 932,284 |
| ssj_ops@100% per JVM | 155,381 |
| Target Load | Actual Load | ssj_ops | |
|---|---|---|---|
| Target | Actual | ||
| Calibration 1 | 156,221 | ||
| Calibration 2 | 155,495 | ||
| Calibration 3 | 155,051 | ||
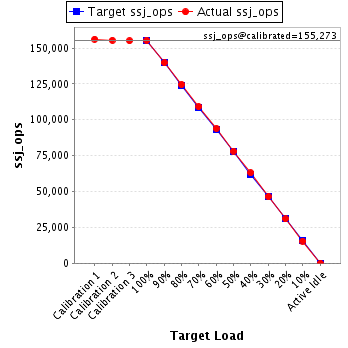
| ssj_ops@calibrated=155,273 | |||
| 100% | 100.1% | 155,273 | 155,392 |
| 90% | 90.1% | 139,746 | 139,829 |
| 80% | 80.2% | 124,218 | 124,594 |
| 70% | 70.3% | 108,691 | 109,206 |
| 60% | 60.5% | 93,164 | 93,965 |
| 50% | 50.4% | 77,637 | 78,257 |
| 40% | 40.6% | 62,109 | 63,003 |
| 30% | 29.9% | 46,582 | 46,441 |
| 20% | 19.9% | 31,055 | 30,898 |
| 10% | 10.0% | 15,527 | 15,512 |
| Active Idle | 0 | 0 | |
| Target Load | Actual Load | ssj_ops | |
|---|---|---|---|
| Target | Actual | ||
| Calibration 1 | 157,786 | ||
| Calibration 2 | 155,994 | ||
| Calibration 3 | 156,629 | ||
| ssj_ops@calibrated=156,311 | |||
| 100% | 99.9% | 156,311 | 156,107 |
| 90% | 89.4% | 140,680 | 139,736 |
| 80% | 79.5% | 125,049 | 124,266 |
| 70% | 69.7% | 109,418 | 109,020 |
| 60% | 60.1% | 93,787 | 93,870 |
| 50% | 49.4% | 78,156 | 77,165 |
| 40% | 39.5% | 62,525 | 61,800 |
| 30% | 30.1% | 46,893 | 47,005 |
| 20% | 20.1% | 31,262 | 31,366 |
| 10% | 10.2% | 15,631 | 16,014 |
| Active Idle | 0 | 0 | |

| Target Load | Actual Load | ssj_ops | |
|---|---|---|---|
| Target | Actual | ||
| Calibration 1 | 158,250 | ||
| Calibration 2 | 157,006 | ||
| Calibration 3 | 156,817 | ||
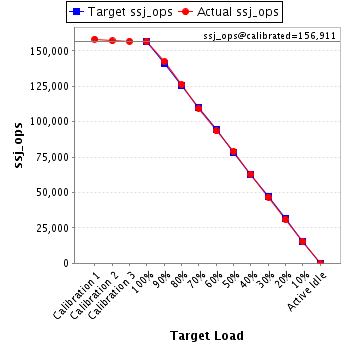
| ssj_ops@calibrated=156,911 | |||
| 100% | 99.8% | 156,911 | 156,659 |
| 90% | 90.7% | 141,220 | 142,357 |
| 80% | 80.4% | 125,529 | 126,125 |
| 70% | 69.7% | 109,838 | 109,426 |
| 60% | 59.6% | 94,147 | 93,503 |
| 50% | 50.3% | 78,456 | 78,944 |
| 40% | 40.1% | 62,765 | 62,943 |
| 30% | 29.8% | 47,073 | 46,788 |
| 20% | 19.8% | 31,382 | 31,108 |
| 10% | 9.9% | 15,691 | 15,533 |
| Active Idle | 0 | 0 | |
| Target Load | Actual Load | ssj_ops | |
|---|---|---|---|
| Target | Actual | ||
| Calibration 1 | 154,767 | ||
| Calibration 2 | 154,019 | ||
| Calibration 3 | 154,531 | ||
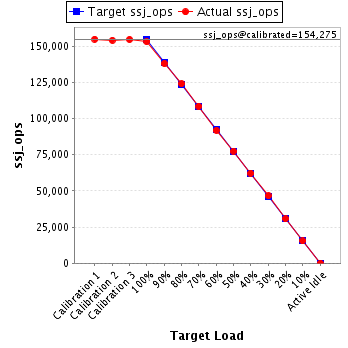
| ssj_ops@calibrated=154,275 | |||
| 100% | 99.2% | 154,275 | 153,036 |
| 90% | 89.4% | 138,847 | 137,895 |
| 80% | 80.3% | 123,420 | 123,855 |
| 70% | 70.3% | 107,992 | 108,409 |
| 60% | 59.5% | 92,565 | 91,735 |
| 50% | 50.3% | 77,137 | 77,524 |
| 40% | 40.3% | 61,710 | 62,239 |
| 30% | 30.2% | 46,282 | 46,529 |
| 20% | 19.9% | 30,855 | 30,644 |
| 10% | 10.0% | 15,427 | 15,417 |
| Active Idle | 0 | 0 | |
| Target Load | Actual Load | ssj_ops | |
|---|---|---|---|
| Target | Actual | ||
| Calibration 1 | 155,312 | ||
| Calibration 2 | 154,910 | ||
| Calibration 3 | 155,455 | ||
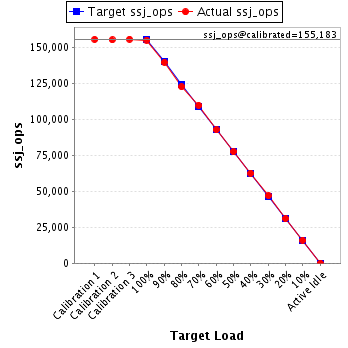
| ssj_ops@calibrated=155,183 | |||
| 100% | 99.8% | 155,183 | 154,818 |
| 90% | 89.9% | 139,664 | 139,446 |
| 80% | 78.9% | 124,146 | 122,375 |
| 70% | 70.6% | 108,628 | 109,604 |
| 60% | 59.7% | 93,110 | 92,589 |
| 50% | 49.8% | 77,591 | 77,345 |
| 40% | 40.3% | 62,073 | 62,513 |
| 30% | 30.2% | 46,555 | 46,850 |
| 20% | 20.0% | 31,037 | 30,960 |
| 10% | 10.3% | 15,518 | 16,046 |
| Active Idle | 0 | 0 | |
| Target Load | Actual Load | ssj_ops | |
|---|---|---|---|
| Target | Actual | ||
| Calibration 1 | 156,813 | ||
| Calibration 2 | 157,057 | ||
| Calibration 3 | 156,761 | ||
| ssj_ops@calibrated=156,909 | |||
| 100% | 99.6% | 156,909 | 156,271 |
| 90% | 90.2% | 141,218 | 141,559 |
| 80% | 79.1% | 125,527 | 124,189 |
| 70% | 70.4% | 109,836 | 110,447 |
| 60% | 60.0% | 94,145 | 94,079 |
| 50% | 50.1% | 78,455 | 78,643 |
| 40% | 39.9% | 62,764 | 62,585 |
| 30% | 30.0% | 47,073 | 47,057 |
| 20% | 20.4% | 31,382 | 32,036 |
| 10% | 9.8% | 15,691 | 15,421 |
| Active Idle | 0 | 0 | |
