SPECpower_ssj2008
Host 'WIN-J6O0JNMR6FF' Performance Report
Copyright © 2007-2011 Standard Performance Evaluation Corporation
| Hitachi, Ltd. BS2000 Server Blade E55A2 | ssj_ops@100% = 926,746 ssj_ops@100% per JVM = 154,458 |
||||
| Test Sponsor: | Hitachi, Ltd. | SPEC License #: | 35 | Test Method: | Multi Node |
| Tested By: | Hitachi, Ltd. | Test Location: | Hadano, Kanagawa, Japan | Test Date: | Feb 20, 2011 |
| Hardware Availability: | Feb-2011 | Software Availability: | Jun-2010 | Publication: | Mar 9, 2011 |
| System Source: | Single Supplier | System Designation: | Server | Power Provisioning: | Line-powered |
| Target Load | Actual Load | ssj_ops | |
|---|---|---|---|
| Target | Actual | ||
| Calibration 1 | 930,866 | ||
| Calibration 2 | 934,277 | ||
| Calibration 3 | 929,784 | ||
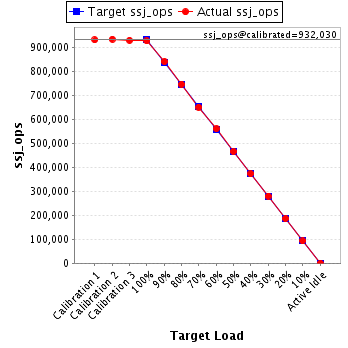
| ssj_ops@calibrated=932,030 | |||
| 100% | 99.4% | 932,030 | 926,746 |
| 90% | 90.2% | 838,827 | 840,822 |
| 80% | 80.1% | 745,624 | 746,775 |
| 70% | 69.9% | 652,421 | 651,140 |
| 60% | 60.2% | 559,218 | 560,797 |
| 50% | 50.0% | 466,015 | 466,416 |
| 40% | 40.0% | 372,812 | 372,851 |
| 30% | 30.1% | 279,609 | 280,352 |
| 20% | 19.9% | 186,406 | 185,914 |
| 10% | 10.0% | 93,203 | 92,925 |
| Active Idle | 0 | 0 | |
| Set Identifier: | sut |
| Set Description: | System Under Test |
| # of Identical Nodes: | 8 |
| Comment: | None |
| Hardware | |
|---|---|
| Hardware Vendor: | Hitachi, Ltd. |
| Model: | BS2000 Server Blade E55A2 |
| Form Factor: | Blade |
| CPU Name: | Intel Xeon X5675 |
| CPU Characteristics: | Six Core, 3.06GHz, 12MB L3 Cache |
| CPU Frequency (MHz): | 3067 |
| CPU(s) Enabled: | 12 cores, 2 chips, 6 cores/chip |
| Hardware Threads: | 24 (2 / core) |
| CPU(s) Orderable: | 1,2 chips |
| Primary Cache: | 32 KB I + 32 KB D on chip per core |
| Secondary Cache: | 256 KB I+D on chip per core |
| Tertiary Cache: | 12 MB I+D on chip per chip |
| Other Cache: | None |
| Memory Amount (GB): | 24 |
| # and size of DIMM: | 6 x 4096 MB |
| Memory Details: | 4GB 2Rx4 PC3L-10600R ECC CL9; slots A0, B0, C0, D0, E0 and F0 populated |
| Power Supply Quantity and Rating (W): | None |
| Power Supply Details: | Shared |
| Disk Drive: | 2 x 147GB 10K rpm 6Gbps SAS 2.5 (Hitachi P/N:GV-UH21472N1) |
| Disk Controller: | Integrated SAS controller |
| # and type of Network Interface Cards (NICs) Installed: | 1 x Intel 82576EB Gigabit Network Connection (onboard) |
| NICs Enabled in Firmware / OS / Connected: | 1/1/1 |
| Network Speed (Mbit): | 1000 |
| Keyboard: | None |
| Mouse: | None |
| Monitor: | None |
| Optical Drives: | No |
| Other Hardware: | None |
| Software | |
|---|---|
| Power Management: | Enabled (Power saver) |
| Operating System (OS): | Microsoft Windows Server 2008 R2 Enterprise |
| OS Version: | R2 |
| Filesystem: | NTFS |
| JVM Vendor: | IBM Corporation |
| JVM Version: | IBM J9 VM (build 2.4, JRE 1.6.0 IBM J9 2.4 Windows Server 2008 amd64-64 jvmwa6460sr7-20100219_54049)(JIT enabled, AOT enabled) |
| JVM Command-line Options: | -Xaggressive -Xcompressedrefs -Xgcpolicy:gencon -Xmn1500m -Xms1875m -Xmx1875m -XlockReservation -Xnoloa -XtlhPrefetch -Xlp |
| JVM Affinity: | start /affinity [F,F0,F00,F000,F0000,F00000] |
| JVM Instances: | 6 |
| JVM Initial Heap (MB): | 1875 |
| JVM Maximum Heap (MB): | 1875 |
| JVM Address Bits: | 64 |
| Boot Firmware Version: | 03-48 |
| Management Firmware Version: | 03-89 |
| Workload Version: | SSJ 1.2.6 |
| Director Location: | Controller |
| Other Software: | IBM WebSphere Application Server V7.0 for Windows on x86-64 bit |
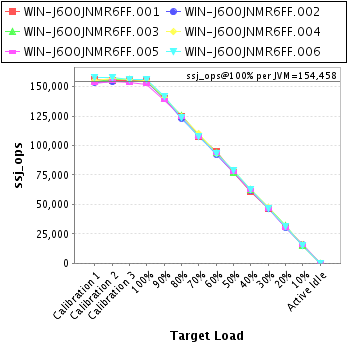
| JVM Instance | ssj_ops@100% |
|---|---|
| WIN-J6O0JNMR6FF.001 | 155,013 |
| WIN-J6O0JNMR6FF.002 | 153,964 |
| WIN-J6O0JNMR6FF.003 | 155,308 |
| WIN-J6O0JNMR6FF.004 | 154,781 |
| WIN-J6O0JNMR6FF.005 | 151,889 |
| WIN-J6O0JNMR6FF.006 | 155,790 |
| ssj_ops@100% | 926,746 |
| ssj_ops@100% per JVM | 154,458 |
| Target Load | Actual Load | ssj_ops | |
|---|---|---|---|
| Target | Actual | ||
| Calibration 1 | 156,052 | ||
| Calibration 2 | 155,225 | ||
| Calibration 3 | 154,835 | ||
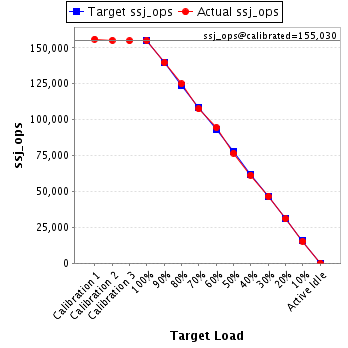
| ssj_ops@calibrated=155,030 | |||
| 100% | 100.0% | 155,030 | 155,013 |
| 90% | 90.2% | 139,527 | 139,847 |
| 80% | 80.6% | 124,024 | 124,935 |
| 70% | 69.4% | 108,521 | 107,537 |
| 60% | 61.0% | 93,018 | 94,522 |
| 50% | 49.5% | 77,515 | 76,684 |
| 40% | 39.6% | 62,012 | 61,330 |
| 30% | 30.0% | 46,509 | 46,556 |
| 20% | 20.0% | 31,006 | 30,935 |
| 10% | 9.9% | 15,503 | 15,308 |
| Active Idle | 0 | 0 | |
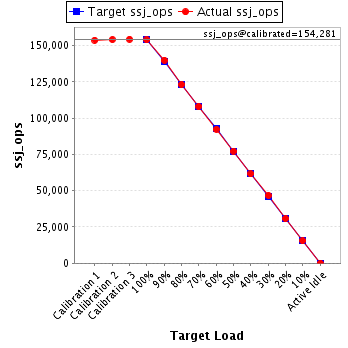
| Target Load | Actual Load | ssj_ops | |
|---|---|---|---|
| Target | Actual | ||
| Calibration 1 | 153,810 | ||
| Calibration 2 | 154,112 | ||
| Calibration 3 | 154,450 | ||
| ssj_ops@calibrated=154,281 | |||
| 100% | 99.8% | 154,281 | 153,964 |
| 90% | 90.7% | 138,853 | 139,969 |
| 80% | 79.8% | 123,425 | 123,134 |
| 70% | 70.1% | 107,997 | 108,079 |
| 60% | 59.9% | 92,569 | 92,397 |
| 50% | 50.1% | 77,141 | 77,361 |
| 40% | 39.9% | 61,712 | 61,548 |
| 30% | 30.3% | 46,284 | 46,766 |
| 20% | 19.9% | 30,856 | 30,749 |
| 10% | 10.1% | 15,428 | 15,523 |
| Active Idle | 0 | 0 | |
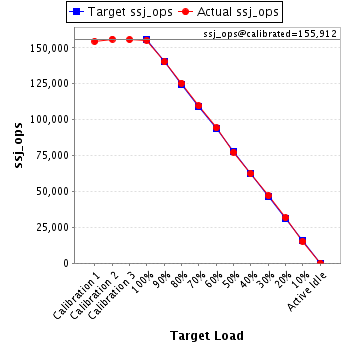
| Target Load | Actual Load | ssj_ops | |
|---|---|---|---|
| Target | Actual | ||
| Calibration 1 | 154,570 | ||
| Calibration 2 | 156,073 | ||
| Calibration 3 | 155,751 | ||
| ssj_ops@calibrated=155,912 | |||
| 100% | 99.6% | 155,912 | 155,308 |
| 90% | 90.0% | 140,321 | 140,279 |
| 80% | 80.5% | 124,730 | 125,482 |
| 70% | 70.3% | 109,138 | 109,559 |
| 60% | 60.5% | 93,547 | 94,274 |
| 50% | 49.6% | 77,956 | 77,405 |
| 40% | 40.0% | 62,365 | 62,340 |
| 30% | 30.1% | 46,774 | 46,998 |
| 20% | 20.3% | 31,182 | 31,695 |
| 10% | 9.8% | 15,591 | 15,204 |
| Active Idle | 0 | 0 | |
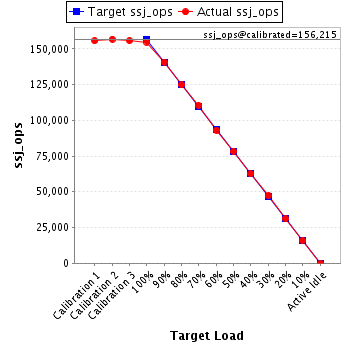
| Target Load | Actual Load | ssj_ops | |
|---|---|---|---|
| Target | Actual | ||
| Calibration 1 | 155,592 | ||
| Calibration 2 | 156,773 | ||
| Calibration 3 | 155,656 | ||
| ssj_ops@calibrated=156,215 | |||
| 100% | 99.1% | 156,215 | 154,781 |
| 90% | 90.1% | 140,593 | 140,781 |
| 80% | 79.9% | 124,972 | 124,773 |
| 70% | 70.7% | 109,350 | 110,397 |
| 60% | 59.6% | 93,729 | 93,155 |
| 50% | 50.2% | 78,107 | 78,488 |
| 40% | 40.0% | 62,486 | 62,537 |
| 30% | 30.2% | 46,864 | 47,109 |
| 20% | 19.9% | 31,243 | 31,087 |
| 10% | 10.1% | 15,621 | 15,757 |
| Active Idle | 0 | 0 | |
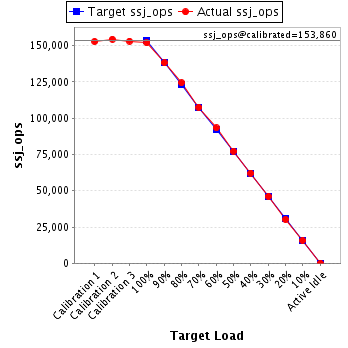
| Target Load | Actual Load | ssj_ops | |
|---|---|---|---|
| Target | Actual | ||
| Calibration 1 | 152,848 | ||
| Calibration 2 | 154,499 | ||
| Calibration 3 | 153,221 | ||
| ssj_ops@calibrated=153,860 | |||
| 100% | 98.7% | 153,860 | 151,889 |
| 90% | 89.8% | 138,474 | 138,203 |
| 80% | 80.8% | 123,088 | 124,369 |
| 70% | 69.9% | 107,702 | 107,551 |
| 60% | 60.7% | 92,316 | 93,322 |
| 50% | 50.3% | 76,930 | 77,366 |
| 40% | 40.4% | 61,544 | 62,195 |
| 30% | 30.0% | 46,158 | 46,146 |
| 20% | 19.6% | 30,772 | 30,170 |
| 10% | 10.3% | 15,386 | 15,812 |
| Active Idle | 0 | 0 | |
| Target Load | Actual Load | ssj_ops | |
|---|---|---|---|
| Target | Actual | ||
| Calibration 1 | 157,994 | ||
| Calibration 2 | 157,595 | ||
| Calibration 3 | 155,870 | ||
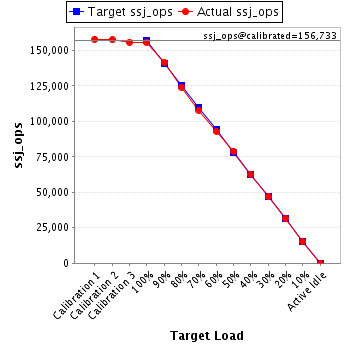
| ssj_ops@calibrated=156,733 | |||
| 100% | 99.4% | 156,733 | 155,790 |
| 90% | 90.4% | 141,059 | 141,742 |
| 80% | 79.2% | 125,386 | 124,082 |
| 70% | 68.9% | 109,713 | 108,017 |
| 60% | 59.4% | 94,040 | 93,127 |
| 50% | 50.5% | 78,366 | 79,113 |
| 40% | 40.1% | 62,693 | 62,901 |
| 30% | 29.8% | 47,020 | 46,778 |
| 20% | 20.0% | 31,347 | 31,279 |
| 10% | 9.8% | 15,673 | 15,320 |
| Active Idle | 0 | 0 | |