SPECpower_ssj2008
Host 'WIN-7T2LA1IMD13' Performance Report
Copyright © 2007-2011 Standard Performance Evaluation Corporation
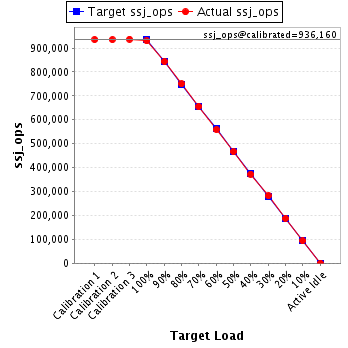
| Hitachi, Ltd. BS2000 Server Blade E55A2 | ssj_ops@100% = 929,821 ssj_ops@100% per JVM = 154,970 |
||||
| Test Sponsor: | Hitachi, Ltd. | SPEC License #: | 35 | Test Method: | Multi Node |
| Tested By: | Hitachi, Ltd. | Test Location: | Hadano, Kanagawa, Japan | Test Date: | Feb 20, 2011 |
| Hardware Availability: | Feb-2011 | Software Availability: | Jun-2010 | Publication: | Mar 9, 2011 |
| System Source: | Single Supplier | System Designation: | Server | Power Provisioning: | Line-powered |
| Target Load | Actual Load | ssj_ops | |
|---|---|---|---|
| Target | Actual | ||
| Calibration 1 | 935,144 | ||
| Calibration 2 | 935,033 | ||
| Calibration 3 | 937,287 | ||
| ssj_ops@calibrated=936,160 | |||
| 100% | 99.3% | 936,160 | 929,821 |
| 90% | 90.2% | 842,544 | 844,058 |
| 80% | 80.1% | 748,928 | 750,027 |
| 70% | 70.0% | 655,312 | 655,500 |
| 60% | 59.7% | 561,696 | 559,142 |
| 50% | 49.8% | 468,080 | 466,652 |
| 40% | 39.9% | 374,464 | 373,078 |
| 30% | 30.1% | 280,848 | 281,737 |
| 20% | 20.1% | 187,232 | 187,859 |
| 10% | 10.0% | 93,616 | 93,445 |
| Active Idle | 0 | 0 | |
| Set Identifier: | sut |
| Set Description: | System Under Test |
| # of Identical Nodes: | 8 |
| Comment: | None |
| Hardware | |
|---|---|
| Hardware Vendor: | Hitachi, Ltd. |
| Model: | BS2000 Server Blade E55A2 |
| Form Factor: | Blade |
| CPU Name: | Intel Xeon X5675 |
| CPU Characteristics: | Six Core, 3.06GHz, 12MB L3 Cache |
| CPU Frequency (MHz): | 3067 |
| CPU(s) Enabled: | 12 cores, 2 chips, 6 cores/chip |
| Hardware Threads: | 24 (2 / core) |
| CPU(s) Orderable: | 1,2 chips |
| Primary Cache: | 32 KB I + 32 KB D on chip per core |
| Secondary Cache: | 256 KB I+D on chip per core |
| Tertiary Cache: | 12 MB I+D on chip per chip |
| Other Cache: | None |
| Memory Amount (GB): | 24 |
| # and size of DIMM: | 6 x 4096 MB |
| Memory Details: | 4GB 2Rx4 PC3L-10600R ECC CL9; slots A0, B0, C0, D0, E0 and F0 populated |
| Power Supply Quantity and Rating (W): | None |
| Power Supply Details: | Shared |
| Disk Drive: | 2 x 147GB 10K rpm 6Gbps SAS 2.5 (Hitachi P/N:GV-UH21472N1) |
| Disk Controller: | Integrated SAS controller |
| # and type of Network Interface Cards (NICs) Installed: | 1 x Intel 82576EB Gigabit Network Connection (onboard) |
| NICs Enabled in Firmware / OS / Connected: | 1/1/1 |
| Network Speed (Mbit): | 1000 |
| Keyboard: | None |
| Mouse: | None |
| Monitor: | None |
| Optical Drives: | No |
| Other Hardware: | None |
| Software | |
|---|---|
| Power Management: | Enabled (Power saver) |
| Operating System (OS): | Microsoft Windows Server 2008 R2 Enterprise |
| OS Version: | R2 |
| Filesystem: | NTFS |
| JVM Vendor: | IBM Corporation |
| JVM Version: | IBM J9 VM (build 2.4, JRE 1.6.0 IBM J9 2.4 Windows Server 2008 amd64-64 jvmwa6460sr7-20100219_54049)(JIT enabled, AOT enabled) |
| JVM Command-line Options: | -Xaggressive -Xcompressedrefs -Xgcpolicy:gencon -Xmn1500m -Xms1875m -Xmx1875m -XlockReservation -Xnoloa -XtlhPrefetch -Xlp |
| JVM Affinity: | start /affinity [F,F0,F00,F000,F0000,F00000] |
| JVM Instances: | 6 |
| JVM Initial Heap (MB): | 1875 |
| JVM Maximum Heap (MB): | 1875 |
| JVM Address Bits: | 64 |
| Boot Firmware Version: | 03-48 |
| Management Firmware Version: | 03-89 |
| Workload Version: | SSJ 1.2.6 |
| Director Location: | Controller |
| Other Software: | IBM WebSphere Application Server V7.0 for Windows on x86-64 bit |
| JVM Instance | ssj_ops@100% |
|---|---|
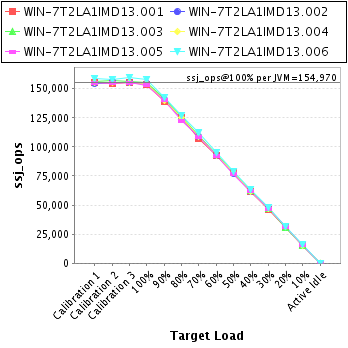
| WIN-7T2LA1IMD13.001 | 153,946 |
| WIN-7T2LA1IMD13.002 | 154,867 |
| WIN-7T2LA1IMD13.003 | 155,221 |
| WIN-7T2LA1IMD13.004 | 154,777 |
| WIN-7T2LA1IMD13.005 | 153,191 |
| WIN-7T2LA1IMD13.006 | 157,820 |
| ssj_ops@100% | 929,821 |
| ssj_ops@100% per JVM | 154,970 |
| Target Load | Actual Load | ssj_ops | |
|---|---|---|---|
| Target | Actual | ||
| Calibration 1 | 155,198 | ||
| Calibration 2 | 154,735 | ||
| Calibration 3 | 155,242 | ||
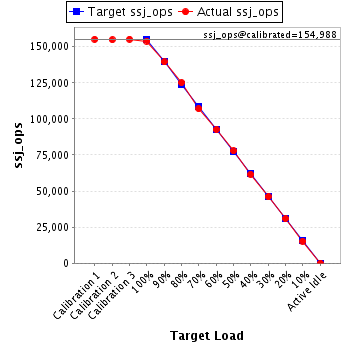
| ssj_ops@calibrated=154,988 | |||
| 100% | 99.3% | 154,988 | 153,946 |
| 90% | 90.0% | 139,489 | 139,434 |
| 80% | 80.7% | 123,991 | 125,038 |
| 70% | 69.0% | 108,492 | 107,011 |
| 60% | 59.8% | 92,993 | 92,650 |
| 50% | 50.2% | 77,494 | 77,794 |
| 40% | 39.7% | 61,995 | 61,577 |
| 30% | 29.7% | 46,496 | 46,046 |
| 20% | 19.9% | 30,998 | 30,870 |
| 10% | 9.9% | 15,499 | 15,369 |
| Active Idle | 0 | 0 | |
| Target Load | Actual Load | ssj_ops | |
|---|---|---|---|
| Target | Actual | ||
| Calibration 1 | 154,727 | ||
| Calibration 2 | 155,787 | ||
| Calibration 3 | 155,330 | ||
| ssj_ops@calibrated=155,558 | |||
| 100% | 99.6% | 155,558 | 154,867 |
| 90% | 90.4% | 140,003 | 140,688 |
| 80% | 79.9% | 124,447 | 124,351 |
| 70% | 70.1% | 108,891 | 109,064 |
| 60% | 59.6% | 93,335 | 92,718 |
| 50% | 49.7% | 77,779 | 77,385 |
| 40% | 39.8% | 62,223 | 61,918 |
| 30% | 30.4% | 46,668 | 47,362 |
| 20% | 20.3% | 31,112 | 31,556 |
| 10% | 10.0% | 15,556 | 15,621 |
| Active Idle | 0 | 0 | |

| Target Load | Actual Load | ssj_ops | |
|---|---|---|---|
| Target | Actual | ||
| Calibration 1 | 156,527 | ||
| Calibration 2 | 156,702 | ||
| Calibration 3 | 156,410 | ||
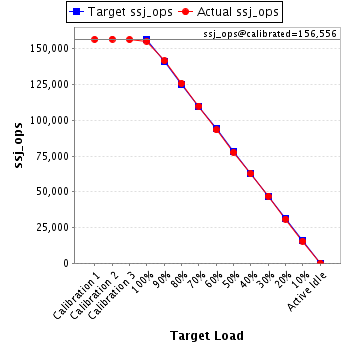
| ssj_ops@calibrated=156,556 | |||
| 100% | 99.1% | 156,556 | 155,221 |
| 90% | 90.4% | 140,900 | 141,574 |
| 80% | 80.4% | 125,245 | 125,883 |
| 70% | 70.2% | 109,589 | 109,942 |
| 60% | 59.6% | 93,934 | 93,297 |
| 50% | 49.6% | 78,278 | 77,631 |
| 40% | 39.9% | 62,622 | 62,534 |
| 30% | 30.0% | 46,967 | 46,925 |
| 20% | 19.8% | 31,311 | 30,941 |
| 10% | 9.9% | 15,656 | 15,467 |
| Active Idle | 0 | 0 | |
| Target Load | Actual Load | ssj_ops | |
|---|---|---|---|
| Target | Actual | ||
| Calibration 1 | 155,122 | ||
| Calibration 2 | 155,398 | ||
| Calibration 3 | 155,389 | ||
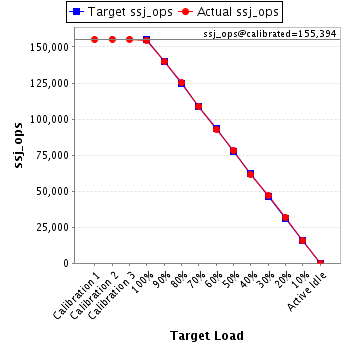
| ssj_ops@calibrated=155,394 | |||
| 100% | 99.6% | 155,394 | 154,777 |
| 90% | 90.0% | 139,854 | 139,812 |
| 80% | 80.5% | 124,315 | 125,115 |
| 70% | 70.1% | 108,775 | 108,923 |
| 60% | 59.8% | 93,236 | 92,951 |
| 50% | 50.2% | 77,697 | 78,054 |
| 40% | 39.7% | 62,157 | 61,708 |
| 30% | 30.1% | 46,618 | 46,771 |
| 20% | 20.4% | 31,079 | 31,667 |
| 10% | 10.1% | 15,539 | 15,667 |
| Active Idle | 0 | 0 | |
| Target Load | Actual Load | ssj_ops | |
|---|---|---|---|
| Target | Actual | ||
| Calibration 1 | 155,008 | ||
| Calibration 2 | 154,678 | ||
| Calibration 3 | 154,997 | ||
| ssj_ops@calibrated=154,838 | |||
| 100% | 98.9% | 154,838 | 153,191 |
| 90% | 90.4% | 139,354 | 139,992 |
| 80% | 79.0% | 123,870 | 122,302 |
| 70% | 70.1% | 108,386 | 108,582 |
| 60% | 59.6% | 92,903 | 92,245 |
| 50% | 49.5% | 77,419 | 76,656 |
| 40% | 40.0% | 61,935 | 61,942 |
| 30% | 30.2% | 46,451 | 46,792 |
| 20% | 20.2% | 30,968 | 31,280 |
| 10% | 9.9% | 15,484 | 15,287 |
| Active Idle | 0 | 0 | |

| Target Load | Actual Load | ssj_ops | |
|---|---|---|---|
| Target | Actual | ||
| Calibration 1 | 158,562 | ||
| Calibration 2 | 157,734 | ||
| Calibration 3 | 159,918 | ||
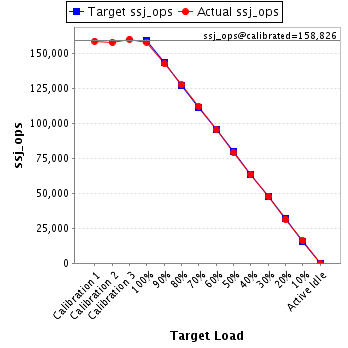
| ssj_ops@calibrated=158,826 | |||
| 100% | 99.4% | 158,826 | 157,820 |
| 90% | 89.8% | 142,944 | 142,559 |
| 80% | 80.2% | 127,061 | 127,338 |
| 70% | 70.5% | 111,178 | 111,978 |
| 60% | 60.0% | 95,296 | 95,281 |
| 50% | 49.8% | 79,413 | 79,133 |
| 40% | 39.9% | 63,530 | 63,400 |
| 30% | 30.1% | 47,648 | 47,842 |
| 20% | 19.9% | 31,765 | 31,544 |
| 10% | 10.1% | 15,883 | 16,034 |
| Active Idle | 0 | 0 | |