SPECpower_ssj2008
Host 'Node-3-optimus' Performance Report
Copyright © 2007-2010 Standard Performance Evaluation Corporation
| Hewlett-Packard Company ProLiant DL170e G6 | ssj_ops@100% = 722,617 ssj_ops@100% per JVM = 120,436 |
||||
| Test Sponsor: | Hewlett-Packard Company | SPEC License #: | 3 | Test Method: | Multi Node |
| Tested By: | Hewlett-Packard Company | Test Location: | Houston, TX, USA | Test Date: | Nov 13, 2010 |
| Hardware Availability: | Nov-2010 | Software Availability: | Sep-2009 | Publication: | Dec 1, 2010 |
| System Source: | Single Supplier | System Designation: | Server | Power Provisioning: | Line-powered |
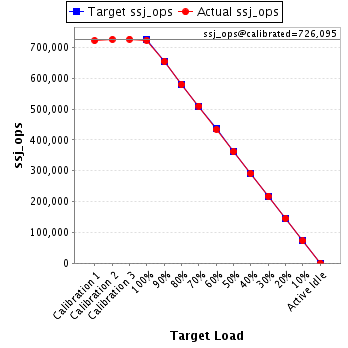
| Target Load | Actual Load | ssj_ops | |
|---|---|---|---|
| Target | Actual | ||
| Calibration 1 | 721,892 | ||
| Calibration 2 | 725,568 | ||
| Calibration 3 | 726,621 | ||
| ssj_ops@calibrated=726,095 | |||
| 100% | 99.5% | 726,095 | 722,617 |
| 90% | 90.1% | 653,485 | 654,162 |
| 80% | 79.8% | 580,876 | 579,495 |
| 70% | 70.2% | 508,266 | 509,909 |
| 60% | 59.8% | 435,657 | 434,097 |
| 50% | 49.8% | 363,047 | 361,768 |
| 40% | 40.1% | 290,438 | 291,179 |
| 30% | 30.0% | 217,828 | 217,671 |
| 20% | 20.0% | 145,219 | 145,459 |
| 10% | 10.0% | 72,609 | 72,639 |
| Active Idle | 0 | 0 | |
| Set Identifier: | sut |
| Set Description: | ProLiant DL170e G6 |
| # of Identical Nodes: | 4 |
| Comment: | None |
| Hardware | |
|---|---|
| Hardware Vendor: | Hewlett-Packard Company |
| Model: | ProLiant DL170e G6 |
| Form Factor: | 2U |
| CPU Name: | Intel Xeon L5640 |
| CPU Characteristics: | Six-Core, 2.27 GHz, 12 MB L3 Cache |
| CPU Frequency (MHz): | 2267 |
| CPU(s) Enabled: | 12 cores, 2 chips, 6 cores/chip |
| Hardware Threads: | 24 (2 / core) |
| CPU(s) Orderable: | 1,2 chips |
| Primary Cache: | 32 KB I + 32 KB D on chip per core |
| Secondary Cache: | 256 KB I+D on chip per core |
| Tertiary Cache: | 12 MB I+D on chip per chip |
| Other Cache: | None |
| Memory Amount (GB): | 16 |
| # and size of DIMM: | 4 x 4096 MB |
| Memory Details: | 4GB 2Rx8 PC3L-10600E ECC CL5; slots 1, 5, populated per proc |
| Power Supply Quantity and Rating (W): | None |
| Power Supply Details: | Shared |
| Disk Drive: | 1 x 120 GB SATA SSD, HP Part #539557-010 |
| Disk Controller: | Integrated SATA controller |
| # and type of Network Interface Cards (NICs) Installed: | 1 x HP NC362i Integrated Dual Port Gigabit Server Adapter |
| NICs Enabled in Firmware / OS / Connected: | 1/1/1 |
| Network Speed (Mbit): | 1000 |
| Keyboard: | None |
| Mouse: | None |
| Monitor: | None |
| Optical Drives: | No |
| Other Hardware: | None |
| Software | |
|---|---|
| Power Management: | Power saver enabled in OS |
| Operating System (OS): | Windows Server 2008, Enterprise Edition |
| OS Version: | R2 |
| Filesystem: | NTFS |
| JVM Vendor: | IBM Corporation |
| JVM Version: | IBM J9 VM (build 2.4, J2RE 1.6.0 IBM J9 2.4 Windows Server 2008 amd64-64 jvmwa660sr5-20090519_35743 (JIT enabled, AOT enabled) |
| JVM Command-line Options: | -Xaggressive -Xcompressedrefs -Xgcpolicy:gencon -Xmn1600m -Xms2000m -Xmx2000m -XlockReservation -Xnoloa -XtlhPrefetch -Xlp |
| JVM Affinity: | start /affinity [F,F0,F00,F000,F0000,F00000] |
| JVM Instances: | 6 |
| JVM Initial Heap (MB): | 2000 |
| JVM Maximum Heap (MB): | 2000 |
| JVM Address Bits: | 64 |
| Boot Firmware Version: | 034 10/25/10 |
| Management Firmware Version: | 4.21 7/16/10 |
| Workload Version: | SSJ 1.2.6 |
| Director Location: | Controller |
| Other Software: | IBM Websphere Application Server |
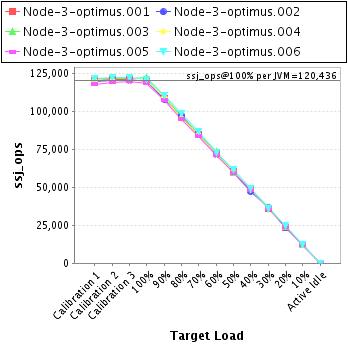
| JVM Instance | ssj_ops@100% |
|---|---|
| Node-3-optimus.001 | 119,599 |
| Node-3-optimus.002 | 120,357 |
| Node-3-optimus.003 | 122,303 |
| Node-3-optimus.004 | 120,215 |
| Node-3-optimus.005 | 118,782 |
| Node-3-optimus.006 | 121,362 |
| ssj_ops@100% | 722,617 |
| ssj_ops@100% per JVM | 120,436 |
| Target Load | Actual Load | ssj_ops | |
|---|---|---|---|
| Target | Actual | ||
| Calibration 1 | 120,348 | ||
| Calibration 2 | 120,881 | ||
| Calibration 3 | 121,034 | ||
| ssj_ops@calibrated=120,958 | |||
| 100% | 98.9% | 120,958 | 119,599 |
| 90% | 89.7% | 108,862 | 108,559 |
| 80% | 79.6% | 96,766 | 96,253 |
| 70% | 70.0% | 84,670 | 84,714 |
| 60% | 59.9% | 72,575 | 72,421 |
| 50% | 50.0% | 60,479 | 60,439 |
| 40% | 40.1% | 48,383 | 48,558 |
| 30% | 29.6% | 36,287 | 35,857 |
| 20% | 19.6% | 24,192 | 23,749 |
| 10% | 10.0% | 12,096 | 12,125 |
| Active Idle | 0 | 0 | |
| Target Load | Actual Load | ssj_ops | |
|---|---|---|---|
| Target | Actual | ||
| Calibration 1 | 119,996 | ||
| Calibration 2 | 120,496 | ||
| Calibration 3 | 120,622 | ||
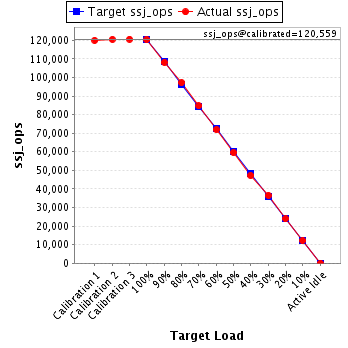
| ssj_ops@calibrated=120,559 | |||
| 100% | 99.8% | 120,559 | 120,357 |
| 90% | 89.7% | 108,503 | 108,144 |
| 80% | 80.6% | 96,447 | 97,182 |
| 70% | 70.3% | 84,391 | 84,695 |
| 60% | 59.7% | 72,335 | 71,916 |
| 50% | 49.4% | 60,279 | 59,579 |
| 40% | 39.2% | 48,224 | 47,272 |
| 30% | 30.3% | 36,168 | 36,532 |
| 20% | 19.8% | 24,112 | 23,887 |
| 10% | 10.1% | 12,056 | 12,224 |
| Active Idle | 0 | 0 | |
| Target Load | Actual Load | ssj_ops | |
|---|---|---|---|
| Target | Actual | ||
| Calibration 1 | 121,601 | ||
| Calibration 2 | 121,835 | ||
| Calibration 3 | 121,629 | ||
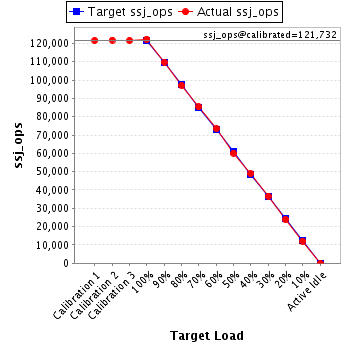
| ssj_ops@calibrated=121,732 | |||
| 100% | 100.5% | 121,732 | 122,303 |
| 90% | 90.2% | 109,559 | 109,767 |
| 80% | 79.8% | 97,386 | 97,093 |
| 70% | 70.1% | 85,213 | 85,363 |
| 60% | 60.4% | 73,039 | 73,539 |
| 50% | 49.4% | 60,866 | 60,146 |
| 40% | 40.2% | 48,693 | 48,980 |
| 30% | 30.1% | 36,520 | 36,652 |
| 20% | 19.7% | 24,346 | 23,999 |
| 10% | 10.0% | 12,173 | 12,133 |
| Active Idle | 0 | 0 | |
| Target Load | Actual Load | ssj_ops | |
|---|---|---|---|
| Target | Actual | ||
| Calibration 1 | 120,297 | ||
| Calibration 2 | 120,426 | ||
| Calibration 3 | 120,745 | ||
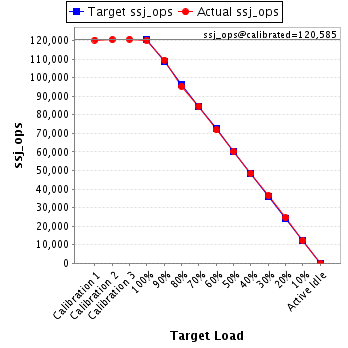
| ssj_ops@calibrated=120,585 | |||
| 100% | 99.7% | 120,585 | 120,215 |
| 90% | 90.8% | 108,527 | 109,518 |
| 80% | 79.1% | 96,468 | 95,337 |
| 70% | 70.2% | 84,410 | 84,677 |
| 60% | 59.7% | 72,351 | 71,942 |
| 50% | 50.0% | 60,293 | 60,313 |
| 40% | 40.2% | 48,234 | 48,444 |
| 30% | 30.1% | 36,176 | 36,300 |
| 20% | 20.4% | 24,117 | 24,620 |
| 10% | 10.1% | 12,059 | 12,162 |
| Active Idle | 0 | 0 | |
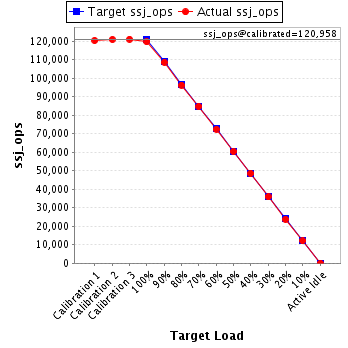
| Target Load | Actual Load | ssj_ops | |
|---|---|---|---|
| Target | Actual | ||
| Calibration 1 | 118,046 | ||
| Calibration 2 | 119,232 | ||
| Calibration 3 | 120,006 | ||
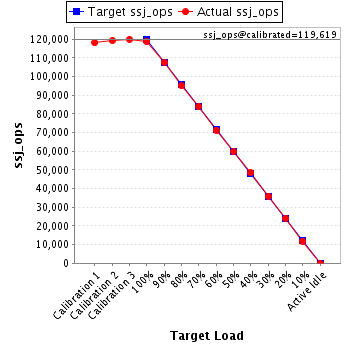
| ssj_ops@calibrated=119,619 | |||
| 100% | 99.3% | 119,619 | 118,782 |
| 90% | 90.0% | 107,657 | 107,617 |
| 80% | 79.4% | 95,695 | 94,949 |
| 70% | 70.1% | 83,733 | 83,892 |
| 60% | 59.6% | 71,771 | 71,308 |
| 50% | 50.0% | 59,809 | 59,769 |
| 40% | 40.5% | 47,848 | 48,442 |
| 30% | 30.0% | 35,886 | 35,905 |
| 20% | 20.2% | 23,924 | 24,178 |
| 10% | 10.0% | 11,962 | 11,912 |
| Active Idle | 0 | 0 | |
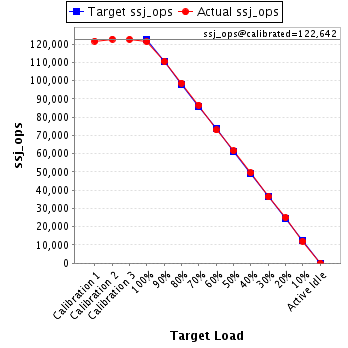
| Target Load | Actual Load | ssj_ops | |
|---|---|---|---|
| Target | Actual | ||
| Calibration 1 | 121,604 | ||
| Calibration 2 | 122,698 | ||
| Calibration 3 | 122,585 | ||
| ssj_ops@calibrated=122,642 | |||
| 100% | 99.0% | 122,642 | 121,362 |
| 90% | 90.1% | 110,377 | 110,557 |
| 80% | 80.5% | 98,113 | 98,680 |
| 70% | 70.6% | 85,849 | 86,568 |
| 60% | 59.5% | 73,585 | 72,970 |
| 50% | 50.2% | 61,321 | 61,522 |
| 40% | 40.3% | 49,057 | 49,483 |
| 30% | 29.7% | 36,792 | 36,424 |
| 20% | 20.4% | 24,528 | 25,024 |
| 10% | 9.9% | 12,264 | 12,083 |
| Active Idle | 0 | 0 | |