SPECpower_ssj2008
Host 'Node-2-optimus' Performance Report
Copyright © 2007-2010 Standard Performance Evaluation Corporation
| Hewlett-Packard Company ProLiant DL170e G6 | ssj_ops@100% = 724,297 ssj_ops@100% per JVM = 120,716 |
||||
| Test Sponsor: | Hewlett-Packard Company | SPEC License #: | 3 | Test Method: | Multi Node |
| Tested By: | Hewlett-Packard Company | Test Location: | Houston, TX, USA | Test Date: | Nov 13, 2010 |
| Hardware Availability: | Nov-2010 | Software Availability: | Sep-2009 | Publication: | Dec 1, 2010 |
| System Source: | Single Supplier | System Designation: | Server | Power Provisioning: | Line-powered |
| Target Load | Actual Load | ssj_ops | |
|---|---|---|---|
| Target | Actual | ||
| Calibration 1 | 723,118 | ||
| Calibration 2 | 725,881 | ||
| Calibration 3 | 727,250 | ||
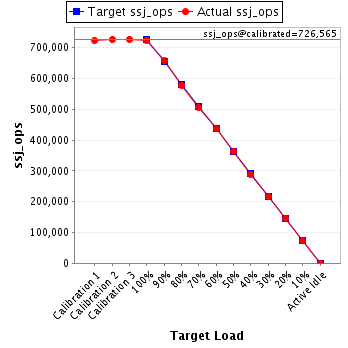
| ssj_ops@calibrated=726,565 | |||
| 100% | 99.7% | 726,565 | 724,297 |
| 90% | 90.4% | 653,909 | 656,910 |
| 80% | 79.6% | 581,252 | 578,490 |
| 70% | 69.8% | 508,596 | 506,806 |
| 60% | 60.0% | 435,939 | 436,110 |
| 50% | 50.1% | 363,283 | 364,175 |
| 40% | 39.8% | 290,626 | 289,410 |
| 30% | 30.0% | 217,970 | 217,628 |
| 20% | 20.0% | 145,313 | 145,128 |
| 10% | 9.9% | 72,657 | 72,269 |
| Active Idle | 0 | 0 | |
| Set Identifier: | sut |
| Set Description: | ProLiant DL170e G6 |
| # of Identical Nodes: | 4 |
| Comment: | None |
| Hardware | |
|---|---|
| Hardware Vendor: | Hewlett-Packard Company |
| Model: | ProLiant DL170e G6 |
| Form Factor: | 2U |
| CPU Name: | Intel Xeon L5640 |
| CPU Characteristics: | Six-Core, 2.27 GHz, 12 MB L3 Cache |
| CPU Frequency (MHz): | 2267 |
| CPU(s) Enabled: | 12 cores, 2 chips, 6 cores/chip |
| Hardware Threads: | 24 (2 / core) |
| CPU(s) Orderable: | 1,2 chips |
| Primary Cache: | 32 KB I + 32 KB D on chip per core |
| Secondary Cache: | 256 KB I+D on chip per core |
| Tertiary Cache: | 12 MB I+D on chip per chip |
| Other Cache: | None |
| Memory Amount (GB): | 16 |
| # and size of DIMM: | 4 x 4096 MB |
| Memory Details: | 4GB 2Rx8 PC3L-10600E ECC CL5; slots 1, 5, populated per proc |
| Power Supply Quantity and Rating (W): | None |
| Power Supply Details: | Shared |
| Disk Drive: | 1 x 120 GB SATA SSD, HP Part #539557-010 |
| Disk Controller: | Integrated SATA controller |
| # and type of Network Interface Cards (NICs) Installed: | 1 x HP NC362i Integrated Dual Port Gigabit Server Adapter |
| NICs Enabled in Firmware / OS / Connected: | 1/1/1 |
| Network Speed (Mbit): | 1000 |
| Keyboard: | None |
| Mouse: | None |
| Monitor: | None |
| Optical Drives: | No |
| Other Hardware: | None |
| Software | |
|---|---|
| Power Management: | Power saver enabled in OS |
| Operating System (OS): | Windows Server 2008, Enterprise Edition |
| OS Version: | R2 |
| Filesystem: | NTFS |
| JVM Vendor: | IBM Corporation |
| JVM Version: | IBM J9 VM (build 2.4, J2RE 1.6.0 IBM J9 2.4 Windows Server 2008 amd64-64 jvmwa660sr5-20090519_35743 (JIT enabled, AOT enabled) |
| JVM Command-line Options: | -Xaggressive -Xcompressedrefs -Xgcpolicy:gencon -Xmn1600m -Xms2000m -Xmx2000m -XlockReservation -Xnoloa -XtlhPrefetch -Xlp |
| JVM Affinity: | start /affinity [F,F0,F00,F000,F0000,F00000] |
| JVM Instances: | 6 |
| JVM Initial Heap (MB): | 2000 |
| JVM Maximum Heap (MB): | 2000 |
| JVM Address Bits: | 64 |
| Boot Firmware Version: | 034 10/25/10 |
| Management Firmware Version: | 4.21 7/16/10 |
| Workload Version: | SSJ 1.2.6 |
| Director Location: | Controller |
| Other Software: | IBM Websphere Application Server |
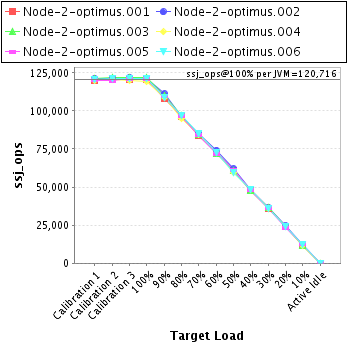
| JVM Instance | ssj_ops@100% |
|---|---|
| Node-2-optimus.001 | 120,399 |
| Node-2-optimus.002 | 121,096 |
| Node-2-optimus.003 | 121,750 |
| Node-2-optimus.004 | 119,294 |
| Node-2-optimus.005 | 120,738 |
| Node-2-optimus.006 | 121,019 |
| ssj_ops@100% | 724,297 |
| ssj_ops@100% per JVM | 120,716 |
| Target Load | Actual Load | ssj_ops | |
|---|---|---|---|
| Target | Actual | ||
| Calibration 1 | 120,275 | ||
| Calibration 2 | 120,638 | ||
| Calibration 3 | 120,630 | ||
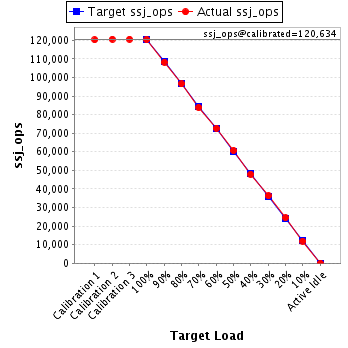
| ssj_ops@calibrated=120,634 | |||
| 100% | 99.8% | 120,634 | 120,399 |
| 90% | 89.8% | 108,571 | 108,302 |
| 80% | 80.0% | 96,507 | 96,516 |
| 70% | 69.5% | 84,444 | 83,841 |
| 60% | 60.3% | 72,381 | 72,715 |
| 50% | 50.3% | 60,317 | 60,713 |
| 40% | 39.7% | 48,254 | 47,944 |
| 30% | 30.1% | 36,190 | 36,259 |
| 20% | 20.3% | 24,127 | 24,442 |
| 10% | 9.9% | 12,063 | 11,959 |
| Active Idle | 0 | 0 | |
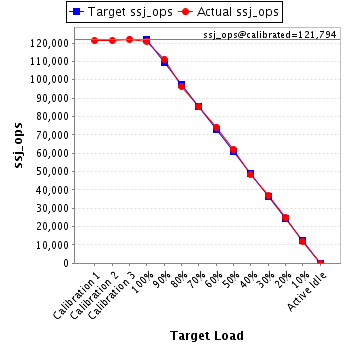
| Target Load | Actual Load | ssj_ops | |
|---|---|---|---|
| Target | Actual | ||
| Calibration 1 | 121,328 | ||
| Calibration 2 | 121,459 | ||
| Calibration 3 | 122,129 | ||
| ssj_ops@calibrated=121,794 | |||
| 100% | 99.4% | 121,794 | 121,096 |
| 90% | 91.3% | 109,615 | 111,199 |
| 80% | 79.2% | 97,435 | 96,448 |
| 70% | 70.2% | 85,256 | 85,469 |
| 60% | 60.9% | 73,076 | 74,166 |
| 50% | 50.8% | 60,897 | 61,917 |
| 40% | 39.8% | 48,718 | 48,445 |
| 30% | 30.2% | 36,538 | 36,741 |
| 20% | 20.3% | 24,359 | 24,700 |
| 10% | 9.9% | 12,179 | 12,041 |
| Active Idle | 0 | 0 | |
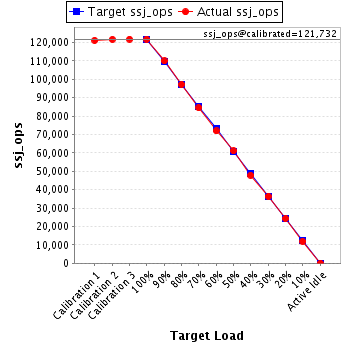
| Target Load | Actual Load | ssj_ops | |
|---|---|---|---|
| Target | Actual | ||
| Calibration 1 | 121,130 | ||
| Calibration 2 | 121,665 | ||
| Calibration 3 | 121,798 | ||
| ssj_ops@calibrated=121,732 | |||
| 100% | 100.0% | 121,732 | 121,750 |
| 90% | 90.3% | 109,559 | 109,945 |
| 80% | 79.8% | 97,386 | 97,172 |
| 70% | 69.4% | 85,212 | 84,438 |
| 60% | 59.1% | 73,039 | 71,918 |
| 50% | 50.1% | 60,866 | 61,042 |
| 40% | 39.3% | 48,693 | 47,806 |
| 30% | 29.9% | 36,520 | 36,355 |
| 20% | 20.0% | 24,346 | 24,297 |
| 10% | 9.8% | 12,173 | 11,912 |
| Active Idle | 0 | 0 | |
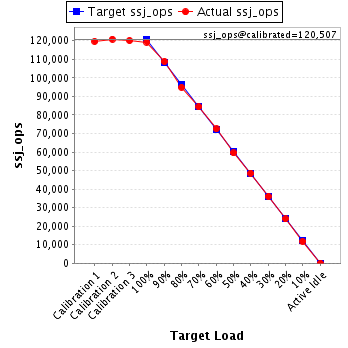
| Target Load | Actual Load | ssj_ops | |
|---|---|---|---|
| Target | Actual | ||
| Calibration 1 | 119,711 | ||
| Calibration 2 | 120,888 | ||
| Calibration 3 | 120,127 | ||
| ssj_ops@calibrated=120,507 | |||
| 100% | 99.0% | 120,507 | 119,294 |
| 90% | 90.3% | 108,457 | 108,842 |
| 80% | 78.8% | 96,406 | 94,960 |
| 70% | 70.0% | 84,355 | 84,329 |
| 60% | 60.2% | 72,304 | 72,486 |
| 50% | 49.4% | 60,254 | 59,500 |
| 40% | 40.3% | 48,203 | 48,596 |
| 30% | 29.9% | 36,152 | 36,092 |
| 20% | 19.8% | 24,101 | 23,904 |
| 10% | 9.8% | 12,051 | 11,825 |
| Active Idle | 0 | 0 | |
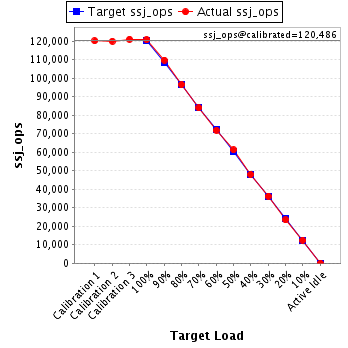
| Target Load | Actual Load | ssj_ops | |
|---|---|---|---|
| Target | Actual | ||
| Calibration 1 | 120,069 | ||
| Calibration 2 | 119,954 | ||
| Calibration 3 | 121,019 | ||
| ssj_ops@calibrated=120,486 | |||
| 100% | 100.2% | 120,486 | 120,738 |
| 90% | 91.1% | 108,438 | 109,740 |
| 80% | 80.0% | 96,389 | 96,424 |
| 70% | 69.6% | 84,340 | 83,881 |
| 60% | 59.6% | 72,292 | 71,842 |
| 50% | 50.8% | 60,243 | 61,219 |
| 40% | 39.8% | 48,195 | 47,932 |
| 30% | 30.1% | 36,146 | 36,234 |
| 20% | 19.4% | 24,097 | 23,378 |
| 10% | 10.4% | 12,049 | 12,511 |
| Active Idle | 0 | 0 | |
| Target Load | Actual Load | ssj_ops | |
|---|---|---|---|
| Target | Actual | ||
| Calibration 1 | 120,604 | ||
| Calibration 2 | 121,277 | ||
| Calibration 3 | 121,546 | ||
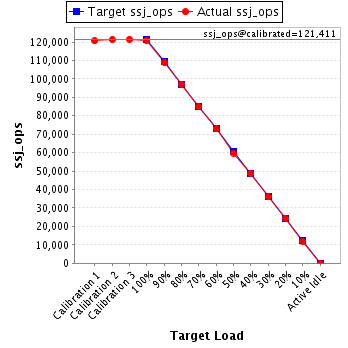
| ssj_ops@calibrated=121,411 | |||
| 100% | 99.7% | 121,411 | 121,019 |
| 90% | 89.7% | 109,270 | 108,882 |
| 80% | 79.9% | 97,129 | 96,971 |
| 70% | 69.9% | 84,988 | 84,848 |
| 60% | 60.1% | 72,847 | 72,983 |
| 50% | 49.2% | 60,706 | 59,784 |
| 40% | 40.1% | 48,565 | 48,686 |
| 30% | 29.6% | 36,423 | 35,946 |
| 20% | 20.1% | 24,282 | 24,406 |
| 10% | 9.9% | 12,141 | 12,021 |
| Active Idle | 0 | 0 | |