SPECpower_ssj2008
Host 'M610-9' Performance Report
Copyright © 2007-2010 Standard Performance Evaluation Corporation
| Dell Inc. PowerEdge M610 | ssj_ops@100% = 909,310 ssj_ops@100% per JVM = 151,552 |
||||
| Test Sponsor: | Dell Inc. | SPEC License #: | 55 | Test Method: | Multi Node |
| Tested By: | Dell Inc. | Test Location: | Round Rock, TX, USA | Test Date: | Aug 12, 2010 |
| Hardware Availability: | Sep-2010 | Software Availability: | Jul-2009 | Publication: | Sep 9, 2010 |
| System Source: | Single Supplier | System Designation: | Server | Power Provisioning: | Line-powered |
| Target Load | Actual Load | ssj_ops | |
|---|---|---|---|
| Target | Actual | ||
| Calibration 1 | 913,930 | ||
| Calibration 2 | 915,759 | ||
| Calibration 3 | 914,215 | ||
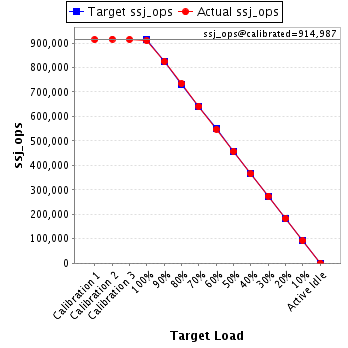
| ssj_ops@calibrated=914,987 | |||
| 100% | 99.4% | 914,987 | 909,310 |
| 90% | 90.2% | 823,488 | 825,084 |
| 80% | 80.3% | 731,990 | 734,438 |
| 70% | 70.1% | 640,491 | 641,222 |
| 60% | 59.9% | 548,992 | 547,643 |
| 50% | 50.0% | 457,494 | 457,459 |
| 40% | 39.9% | 365,995 | 364,905 |
| 30% | 30.0% | 274,496 | 274,696 |
| 20% | 20.0% | 182,997 | 183,325 |
| 10% | 10.1% | 91,499 | 92,476 |
| Active Idle | 0 | 0 | |
| Set Identifier: | sut |
| Set Description: | PowerEdge M610 |
| # of Identical Nodes: | 16 |
| Comment: | None |
| Hardware | |
|---|---|
| Hardware Vendor: | Dell Inc. |
| Model: | PowerEdge M610 |
| Form Factor: | Blade |
| CPU Name: | Intel Xeon X5670 |
| CPU Characteristics: | Six Core, 2.93 GHz, 12 MB L3 Cache |
| CPU Frequency (MHz): | 2933 |
| CPU(s) Enabled: | 12 cores, 2 chips, 6 cores/chip |
| Hardware Threads: | 24 (2 / core) |
| CPU(s) Orderable: | 1,2 chip |
| Primary Cache: | 32 KB I + 32 KB D on chip per core |
| Secondary Cache: | 256 KB I+D on chip per core |
| Tertiary Cache: | 12 MB I+D on chip per chip |
| Other Cache: | None |
| Memory Amount (GB): | 12 |
| # and size of DIMM: | 6 x 2048 MB |
| Memory Details: | 2GB 2Rx8 PC3L-10600E ECC, Slots A1-A3, B1-B3 populated |
| Power Supply Quantity and Rating (W): | None |
| Power Supply Details: | Shared |
| Disk Drive: | 1 x 50GB 2.5" SSD SATA (Dell PN Y949P) |
| Disk Controller: | Modular SATA Pass-Through |
| # and type of Network Interface Cards (NICs) Installed: | 1 x onboard dual-port Gigabit Ethernet |
| NICs Enabled in Firmware / OS / Connected: | 2/1/1 |
| Network Speed (Mbit): | 1000 |
| Keyboard: | None |
| Mouse: | None |
| Monitor: | None |
| Optical Drives: | No |
| Other Hardware: | None |
| Software | |
|---|---|
| Power Management: | Power Saver Mode in OS (See Notes) |
| Operating System (OS): | Windows 2008 Server Enterprise x64 Edition |
| OS Version: | R2 |
| Filesystem: | NTFS |
| JVM Vendor: | IBM Corporation |
| JVM Version: | IBM J9 VM (build 2.4, J2RE 1.6.0 IBM J9 2.4 Windows Server 2008 amd64-64 jvmwa64 60sr5-20090519_35743 (JIT enabled, AOT enabled) |
| JVM Command-line Options: | -Xmn1100m -Xms1500m -Xmx1500m -Xaggressive -Xcompressedrefs -Xgcpolicy:gencon -XlockReservation -Xnoloa -XtlhPrefetch -Xlp |
| JVM Affinity: | start /affinity [F,F0,F00,F000,F0000,F00000] |
| JVM Instances: | 6 |
| JVM Initial Heap (MB): | 1500 |
| JVM Maximum Heap (MB): | 1500 |
| JVM Address Bits: | 64 |
| Boot Firmware Version: | 2.1.9 |
| Management Firmware Version: | iDRAC 3.0.0 A02 / CMC 3.0.1 A00 |
| Workload Version: | SSJ 1.2.6 |
| Director Location: | Controller |
| Other Software: | None |
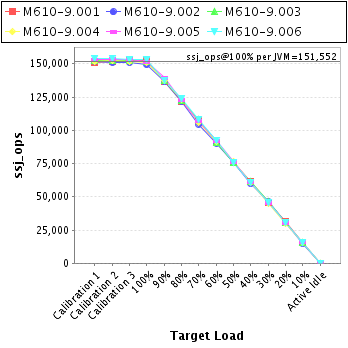
| JVM Instance | ssj_ops@100% |
|---|---|
| M610-9.001 | 152,622 |
| M610-9.002 | 149,315 |
| M610-9.003 | 151,672 |
| M610-9.004 | 151,074 |
| M610-9.005 | 151,687 |
| M610-9.006 | 152,940 |
| ssj_ops@100% | 909,310 |
| ssj_ops@100% per JVM | 151,552 |
| Target Load | Actual Load | ssj_ops | |
|---|---|---|---|
| Target | Actual | ||
| Calibration 1 | 151,235 | ||
| Calibration 2 | 151,904 | ||
| Calibration 3 | 152,767 | ||
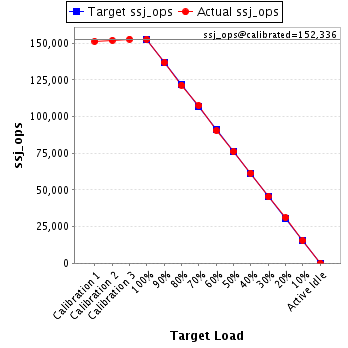
| ssj_ops@calibrated=152,336 | |||
| 100% | 100.2% | 152,336 | 152,622 |
| 90% | 89.9% | 137,102 | 136,884 |
| 80% | 79.7% | 121,868 | 121,443 |
| 70% | 70.6% | 106,635 | 107,557 |
| 60% | 59.4% | 91,401 | 90,444 |
| 50% | 50.0% | 76,168 | 76,143 |
| 40% | 40.3% | 60,934 | 61,448 |
| 30% | 29.8% | 45,701 | 45,429 |
| 20% | 20.4% | 30,467 | 31,100 |
| 10% | 10.2% | 15,234 | 15,537 |
| Active Idle | 0 | 0 | |
| Target Load | Actual Load | ssj_ops | |
|---|---|---|---|
| Target | Actual | ||
| Calibration 1 | 151,766 | ||
| Calibration 2 | 150,929 | ||
| Calibration 3 | 150,865 | ||
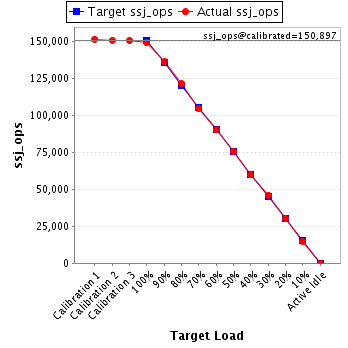
| ssj_ops@calibrated=150,897 | |||
| 100% | 99.0% | 150,897 | 149,315 |
| 90% | 90.3% | 135,807 | 136,316 |
| 80% | 80.6% | 120,718 | 121,554 |
| 70% | 69.4% | 105,628 | 104,708 |
| 60% | 59.8% | 90,538 | 90,283 |
| 50% | 50.2% | 75,449 | 75,820 |
| 40% | 39.6% | 60,359 | 59,813 |
| 30% | 30.6% | 45,269 | 46,175 |
| 20% | 20.2% | 30,179 | 30,459 |
| 10% | 9.9% | 15,090 | 14,889 |
| Active Idle | 0 | 0 | |
| Target Load | Actual Load | ssj_ops | |
|---|---|---|---|
| Target | Actual | ||
| Calibration 1 | 152,394 | ||
| Calibration 2 | 152,729 | ||
| Calibration 3 | 152,416 | ||
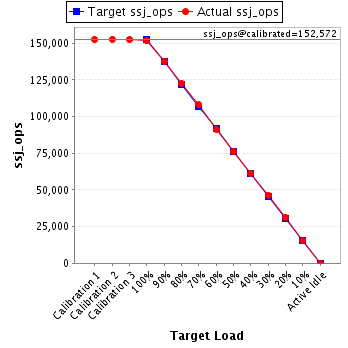
| ssj_ops@calibrated=152,572 | |||
| 100% | 99.4% | 152,572 | 151,672 |
| 90% | 90.0% | 137,315 | 137,332 |
| 80% | 80.3% | 122,058 | 122,498 |
| 70% | 70.8% | 106,801 | 108,038 |
| 60% | 59.8% | 91,543 | 91,167 |
| 50% | 49.9% | 76,286 | 76,142 |
| 40% | 40.3% | 61,029 | 61,461 |
| 30% | 30.5% | 45,772 | 46,465 |
| 20% | 20.2% | 30,514 | 30,891 |
| 10% | 10.1% | 15,257 | 15,342 |
| Active Idle | 0 | 0 | |
| Target Load | Actual Load | ssj_ops | |
|---|---|---|---|
| Target | Actual | ||
| Calibration 1 | 151,349 | ||
| Calibration 2 | 152,582 | ||
| Calibration 3 | 152,009 | ||
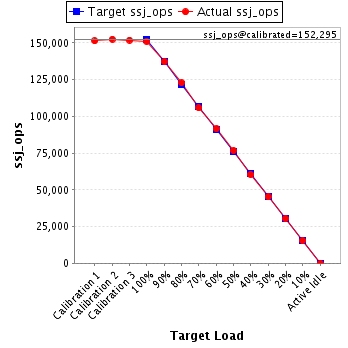
| ssj_ops@calibrated=152,295 | |||
| 100% | 99.2% | 152,295 | 151,074 |
| 90% | 90.2% | 137,066 | 137,371 |
| 80% | 80.7% | 121,836 | 122,827 |
| 70% | 69.5% | 106,607 | 105,805 |
| 60% | 60.1% | 91,377 | 91,498 |
| 50% | 50.4% | 76,148 | 76,727 |
| 40% | 39.7% | 60,918 | 60,401 |
| 30% | 29.7% | 45,689 | 45,167 |
| 20% | 19.8% | 30,459 | 30,219 |
| 10% | 10.0% | 15,230 | 15,300 |
| Active Idle | 0 | 0 | |
| Target Load | Actual Load | ssj_ops | |
|---|---|---|---|
| Target | Actual | ||
| Calibration 1 | 153,210 | ||
| Calibration 2 | 153,394 | ||
| Calibration 3 | 153,162 | ||
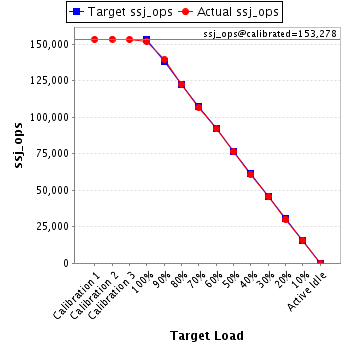
| ssj_ops@calibrated=153,278 | |||
| 100% | 99.0% | 153,278 | 151,687 |
| 90% | 90.9% | 137,950 | 139,379 |
| 80% | 79.9% | 122,623 | 122,417 |
| 70% | 69.7% | 107,295 | 106,775 |
| 60% | 60.0% | 91,967 | 91,954 |
| 50% | 49.9% | 76,639 | 76,507 |
| 40% | 39.8% | 61,311 | 60,989 |
| 30% | 29.8% | 45,983 | 45,613 |
| 20% | 19.8% | 30,656 | 30,297 |
| 10% | 10.3% | 15,328 | 15,808 |
| Active Idle | 0 | 0 | |
| Target Load | Actual Load | ssj_ops | |
|---|---|---|---|
| Target | Actual | ||
| Calibration 1 | 153,976 | ||
| Calibration 2 | 154,220 | ||
| Calibration 3 | 152,997 | ||
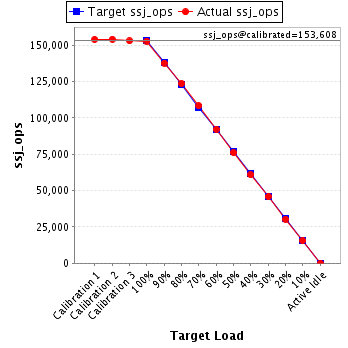
| ssj_ops@calibrated=153,608 | |||
| 100% | 99.6% | 153,608 | 152,940 |
| 90% | 89.7% | 138,248 | 137,802 |
| 80% | 80.5% | 122,887 | 123,698 |
| 70% | 70.5% | 107,526 | 108,339 |
| 60% | 60.1% | 92,165 | 92,296 |
| 50% | 49.6% | 76,804 | 76,120 |
| 40% | 39.6% | 61,443 | 60,793 |
| 30% | 29.8% | 46,083 | 45,847 |
| 20% | 19.8% | 30,722 | 30,358 |
| 10% | 10.2% | 15,361 | 15,600 |
| Active Idle | 0 | 0 | |