SPECpower_ssj2008
Host 'LENA1' Performance Report
Copyright © 2007-2010 Standard Performance Evaluation Corporation
| NEC Corporation Express5800/A1080a-D | ssj_ops@100% = 1,698,355 ssj_ops@100% per JVM = 106,147 |
||||
| Test Sponsor: | NEC Corporation | SPEC License #: | 9006 | Test Method: | Multi Node |
| Tested By: | NEC Corporation | Test Location: | Fuchu, Tokyo, Japan | Test Date: | Jul 5, 2010 |
| Hardware Availability: | May-2010 | Software Availability: | May-2009 | Publication: | Jul 28, 2010 |
| System Source: | Single Supplier | System Designation: | Server | Power Provisioning: | Line-powered |
| Target Load | Actual Load | ssj_ops | |
|---|---|---|---|
| Target | Actual | ||
| Calibration 1 | 1,696,425 | ||
| Calibration 2 | 1,727,700 | ||
| Calibration 3 | 1,726,681 | ||
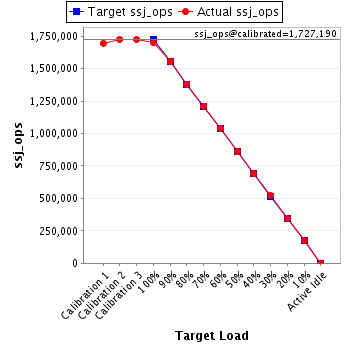
| ssj_ops@calibrated=1,727,190 | |||
| 100% | 98.3% | 1,727,190 | 1,698,355 |
| 90% | 90.1% | 1,554,471 | 1,556,641 |
| 80% | 79.9% | 1,381,752 | 1,380,637 |
| 70% | 70.1% | 1,209,033 | 1,210,079 |
| 60% | 60.0% | 1,036,314 | 1,036,069 |
| 50% | 50.0% | 863,595 | 863,055 |
| 40% | 40.0% | 690,876 | 690,270 |
| 30% | 30.1% | 518,157 | 519,753 |
| 20% | 20.1% | 345,438 | 347,279 |
| 10% | 10.1% | 172,719 | 174,368 |
| Active Idle | 0 | 0 | |
| Set Identifier: | sut |
| Set Description: | Express5800/A1080a-D (Intel Xeon X7560, 2.26 GHz) |
| # of Identical Nodes: | 2 |
| Comment: | None |
| Hardware | |
|---|---|
| Hardware Vendor: | NEC Corporation |
| Model: | Express5800/A1080a-D |
| Form Factor: | Other |
| CPU Name: | Intel Xeon X7560 |
| CPU Characteristics: | Octa-Core, 2.26 GHz, 24 MB L3 Cache |
| CPU Frequency (MHz): | 2266 |
| CPU(s) Enabled: | 32 cores, 4 chips, 8 cores/chip |
| Hardware Threads: | 64 (2 / core) |
| CPU(s) Orderable: | 1,2,3,4 chips |
| Primary Cache: | 32 KB I + 32 KB D on chip per core |
| Secondary Cache: | 256 KB I+D on chip per core |
| Tertiary Cache: | 24 MB I+D on chip per chip |
| Other Cache: | None |
| Memory Amount (GB): | 64 |
| # and size of DIMM: | 16 x 4096 MB |
| Memory Details: | 4GB 2Rx4 PC3-8500R ECC CL7; slots DIMM#1-DIMM#4 populated on each PMM (Processor Memory Module) |
| Power Supply Quantity and Rating (W): | None |
| Power Supply Details: | Shared |
| Disk Drive: | 1 x 300GB 10krpm HDD 2.5inch SAS |
| Disk Controller: | 6Gbps SAS RAID Controller for Embedded HDD/SSD |
| # and type of Network Interface Cards (NICs) Installed: | 1 x Integrated Intel 82576 Gigabit Dual Port Ethernet Controller |
| NICs Enabled in Firmware / OS / Connected: | 2/1/1 |
| Network Speed (Mbit): | 1000 |
| Keyboard: | None |
| Mouse: | None |
| Monitor: | None |
| Optical Drives: | No |
| Other Hardware: | None |
| Software | |
|---|---|
| Power Management: | Power saver |
| Operating System (OS): | Microsoft Windows Server 2008 Enterprise x64 Edition |
| OS Version: | SP2 |
| Filesystem: | NTFS |
| JVM Vendor: | Oracle Corporation |
| JVM Version: | Oracle JRockit(R) 6 P28.0.0 (build P28.0.0-29-114096-1.6.0_11-20090427-1759-windows-x86_64) |
| JVM Command-line Options: | -Xms3700m -Xmx3700m -Xns3300m -XXaggressive -Xlargepages -Xgc:genpar -XXcallprofiling -XXgcthreads=2 -XXtlasize:min=4k,preferred=1024k |
| JVM Affinity: | start /affinity [F,F0,....,F00000000000000,F000000000000000] |
| JVM Instances: | 16 |
| JVM Initial Heap (MB): | 3700 |
| JVM Maximum Heap (MB): | 3700 |
| JVM Address Bits: | 64 |
| Boot Firmware Version: | 1.31 |
| Management Firmware Version: | 1.1.1.8 |
| Workload Version: | SSJ 1.2.6 |
| Director Location: | Controller |
| Other Software: | None |
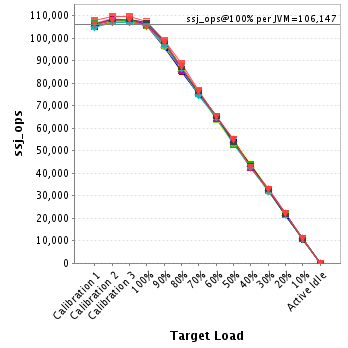
| JVM Instance | ssj_ops@100% |
|---|---|
| LENA1.001 | 107,443 |
| LENA1.002 | 106,543 |
| LENA1.003 | 106,017 |
| LENA1.004 | 106,060 |
| LENA1.005 | 106,720 |
| LENA1.006 | 106,955 |
| LENA1.007 | 105,440 |
| LENA1.008 | 105,970 |
| LENA1.009 | 106,194 |
| LENA1.010 | 105,722 |
| LENA1.011 | 105,589 |
| LENA1.012 | 105,583 |
| LENA1.013 | 106,202 |
| LENA1.014 | 105,563 |
| LENA1.015 | 107,002 |
| LENA1.016 | 105,353 |
| ssj_ops@100% | 1,698,355 |
| ssj_ops@100% per JVM | 106,147 |
| Target Load | Actual Load | ssj_ops | |
|---|---|---|---|
| Target | Actual | ||
| Calibration 1 | 107,718 | ||
| Calibration 2 | 109,403 | ||
| Calibration 3 | 109,648 | ||
| ssj_ops@calibrated=109,525 | |||
| 100% | 98.1% | 109,525 | 107,443 |
| 90% | 90.2% | 98,573 | 98,838 |
| 80% | 80.9% | 87,620 | 88,604 |
| 70% | 69.9% | 76,668 | 76,545 |
| 60% | 59.2% | 65,715 | 64,881 |
| 50% | 50.0% | 54,763 | 54,728 |
| 40% | 39.9% | 43,810 | 43,648 |
| 30% | 29.6% | 32,858 | 32,474 |
| 20% | 19.8% | 21,905 | 21,692 |
| 10% | 10.1% | 10,953 | 11,055 |
| Active Idle | 0 | 0 | |

| Target Load | Actual Load | ssj_ops | |
|---|---|---|---|
| Target | Actual | ||
| Calibration 1 | 106,486 | ||
| Calibration 2 | 108,397 | ||
| Calibration 3 | 108,230 | ||
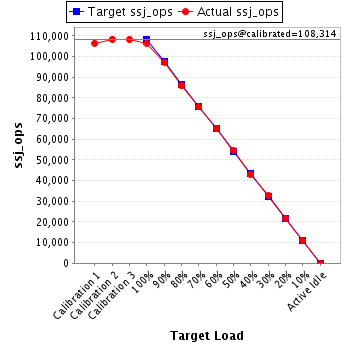
| ssj_ops@calibrated=108,314 | |||
| 100% | 98.4% | 108,314 | 106,543 |
| 90% | 89.8% | 97,482 | 97,258 |
| 80% | 79.2% | 86,651 | 85,751 |
| 70% | 69.9% | 75,819 | 75,716 |
| 60% | 60.3% | 64,988 | 65,348 |
| 50% | 50.3% | 54,157 | 54,526 |
| 40% | 39.9% | 43,325 | 43,166 |
| 30% | 30.3% | 32,494 | 32,776 |
| 20% | 20.2% | 21,663 | 21,845 |
| 10% | 10.0% | 10,831 | 10,879 |
| Active Idle | 0 | 0 | |
| Target Load | Actual Load | ssj_ops | |
|---|---|---|---|
| Target | Actual | ||
| Calibration 1 | 105,966 | ||
| Calibration 2 | 107,740 | ||
| Calibration 3 | 107,630 | ||
| ssj_ops@calibrated=107,685 | |||
| 100% | 98.5% | 107,685 | 106,017 |
| 90% | 90.2% | 96,917 | 97,115 |
| 80% | 80.1% | 86,148 | 86,283 |
| 70% | 70.6% | 75,380 | 75,985 |
| 60% | 59.3% | 64,611 | 63,828 |
| 50% | 49.6% | 53,843 | 53,456 |
| 40% | 39.9% | 43,074 | 42,954 |
| 30% | 29.8% | 32,306 | 32,108 |
| 20% | 20.0% | 21,537 | 21,560 |
| 10% | 10.2% | 10,769 | 10,971 |
| Active Idle | 0 | 0 | |

| Target Load | Actual Load | ssj_ops | |
|---|---|---|---|
| Target | Actual | ||
| Calibration 1 | 105,860 | ||
| Calibration 2 | 108,371 | ||
| Calibration 3 | 108,279 | ||
| ssj_ops@calibrated=108,325 | |||
| 100% | 97.9% | 108,325 | 106,060 |
| 90% | 89.3% | 97,492 | 96,702 |
| 80% | 79.6% | 86,660 | 86,231 |
| 70% | 69.9% | 75,827 | 75,706 |
| 60% | 59.7% | 64,995 | 64,693 |
| 50% | 50.6% | 54,162 | 54,799 |
| 40% | 40.8% | 43,330 | 44,147 |
| 30% | 30.7% | 32,497 | 33,238 |
| 20% | 20.0% | 21,665 | 21,641 |
| 10% | 10.1% | 10,832 | 10,895 |
| Active Idle | 0 | 0 | |

| Target Load | Actual Load | ssj_ops | |
|---|---|---|---|
| Target | Actual | ||
| Calibration 1 | 106,413 | ||
| Calibration 2 | 108,512 | ||
| Calibration 3 | 107,302 | ||
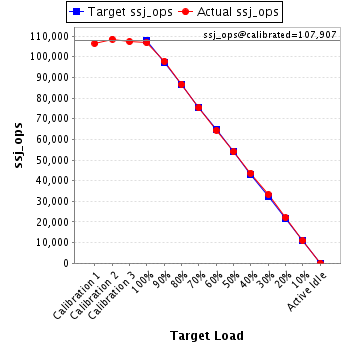
| ssj_ops@calibrated=107,907 | |||
| 100% | 98.9% | 107,907 | 106,720 |
| 90% | 90.6% | 97,116 | 97,806 |
| 80% | 80.3% | 86,326 | 86,599 |
| 70% | 69.8% | 75,535 | 75,280 |
| 60% | 59.6% | 64,744 | 64,366 |
| 50% | 50.0% | 53,954 | 53,959 |
| 40% | 40.4% | 43,163 | 43,623 |
| 30% | 30.9% | 32,372 | 33,296 |
| 20% | 20.5% | 21,581 | 22,070 |
| 10% | 10.2% | 10,791 | 10,966 |
| Active Idle | 0 | 0 | |
| Target Load | Actual Load | ssj_ops | |
|---|---|---|---|
| Target | Actual | ||
| Calibration 1 | 105,857 | ||
| Calibration 2 | 107,895 | ||
| Calibration 3 | 108,040 | ||
| ssj_ops@calibrated=107,967 | |||
| 100% | 99.1% | 107,967 | 106,955 |
| 90% | 89.8% | 97,171 | 96,998 |
| 80% | 80.6% | 86,374 | 86,969 |
| 70% | 69.7% | 75,577 | 75,277 |
| 60% | 60.0% | 64,780 | 64,769 |
| 50% | 49.9% | 53,984 | 53,871 |
| 40% | 39.4% | 43,187 | 42,508 |
| 30% | 29.9% | 32,390 | 32,255 |
| 20% | 19.8% | 21,593 | 21,379 |
| 10% | 10.2% | 10,797 | 10,975 |
| Active Idle | 0 | 0 | |

| Target Load | Actual Load | ssj_ops | |
|---|---|---|---|
| Target | Actual | ||
| Calibration 1 | 106,299 | ||
| Calibration 2 | 107,741 | ||
| Calibration 3 | 107,858 | ||
| ssj_ops@calibrated=107,800 | |||
| 100% | 97.8% | 107,800 | 105,440 |
| 90% | 90.5% | 97,020 | 97,512 |
| 80% | 79.9% | 86,240 | 86,114 |
| 70% | 69.8% | 75,460 | 75,219 |
| 60% | 60.1% | 64,680 | 64,778 |
| 50% | 49.7% | 53,900 | 53,561 |
| 40% | 39.8% | 43,120 | 42,882 |
| 30% | 30.1% | 32,340 | 32,472 |
| 20% | 20.0% | 21,560 | 21,554 |
| 10% | 10.2% | 10,780 | 10,991 |
| Active Idle | 0 | 0 | |

| Target Load | Actual Load | ssj_ops | |
|---|---|---|---|
| Target | Actual | ||
| Calibration 1 | 105,119 | ||
| Calibration 2 | 108,225 | ||
| Calibration 3 | 107,890 | ||
| ssj_ops@calibrated=108,058 | |||
| 100% | 98.1% | 108,058 | 105,970 |
| 90% | 89.3% | 97,252 | 96,504 |
| 80% | 79.7% | 86,446 | 86,147 |
| 70% | 69.9% | 75,640 | 75,492 |
| 60% | 60.2% | 64,835 | 65,078 |
| 50% | 49.9% | 54,029 | 53,922 |
| 40% | 39.3% | 43,223 | 42,503 |
| 30% | 29.9% | 32,417 | 32,284 |
| 20% | 20.1% | 21,612 | 21,706 |
| 10% | 10.2% | 10,806 | 10,992 |
| Active Idle | 0 | 0 | |

| Target Load | Actual Load | ssj_ops | |
|---|---|---|---|
| Target | Actual | ||
| Calibration 1 | 106,240 | ||
| Calibration 2 | 108,042 | ||
| Calibration 3 | 107,611 | ||
| ssj_ops@calibrated=107,826 | |||
| 100% | 98.5% | 107,826 | 106,194 |
| 90% | 90.8% | 97,044 | 97,893 |
| 80% | 78.8% | 86,261 | 85,011 |
| 70% | 70.4% | 75,478 | 75,887 |
| 60% | 60.2% | 64,696 | 64,962 |
| 50% | 50.2% | 53,913 | 54,128 |
| 40% | 40.3% | 43,131 | 43,486 |
| 30% | 30.0% | 32,348 | 32,372 |
| 20% | 20.6% | 21,565 | 22,238 |
| 10% | 9.7% | 10,783 | 10,510 |
| Active Idle | 0 | 0 | |

| Target Load | Actual Load | ssj_ops | |
|---|---|---|---|
| Target | Actual | ||
| Calibration 1 | 105,172 | ||
| Calibration 2 | 107,217 | ||
| Calibration 3 | 107,237 | ||
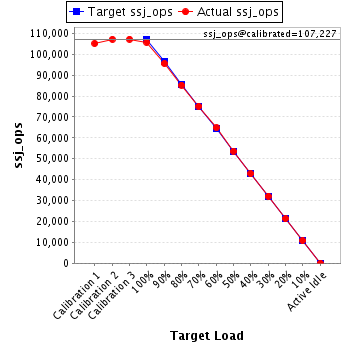
| ssj_ops@calibrated=107,227 | |||
| 100% | 98.6% | 107,227 | 105,722 |
| 90% | 89.2% | 96,504 | 95,596 |
| 80% | 79.5% | 85,781 | 85,281 |
| 70% | 70.1% | 75,059 | 75,152 |
| 60% | 60.5% | 64,336 | 64,835 |
| 50% | 50.1% | 53,613 | 53,705 |
| 40% | 40.0% | 42,891 | 42,864 |
| 30% | 30.0% | 32,168 | 32,142 |
| 20% | 19.9% | 21,445 | 21,321 |
| 10% | 10.2% | 10,723 | 10,896 |
| Active Idle | 0 | 0 | |
| Target Load | Actual Load | ssj_ops | |
|---|---|---|---|
| Target | Actual | ||
| Calibration 1 | 106,290 | ||
| Calibration 2 | 107,864 | ||
| Calibration 3 | 107,938 | ||
| ssj_ops@calibrated=107,901 | |||
| 100% | 97.9% | 107,901 | 105,589 |
| 90% | 90.7% | 97,111 | 97,867 |
| 80% | 79.3% | 86,321 | 85,571 |
| 70% | 70.2% | 75,531 | 75,745 |
| 60% | 60.2% | 64,741 | 64,979 |
| 50% | 48.9% | 53,951 | 52,815 |
| 40% | 40.6% | 43,160 | 43,798 |
| 30% | 30.0% | 32,370 | 32,382 |
| 20% | 19.9% | 21,580 | 21,437 |
| 10% | 10.0% | 10,790 | 10,826 |
| Active Idle | 0 | 0 | |

| Target Load | Actual Load | ssj_ops | |
|---|---|---|---|
| Target | Actual | ||
| Calibration 1 | 105,786 | ||
| Calibration 2 | 107,311 | ||
| Calibration 3 | 107,398 | ||
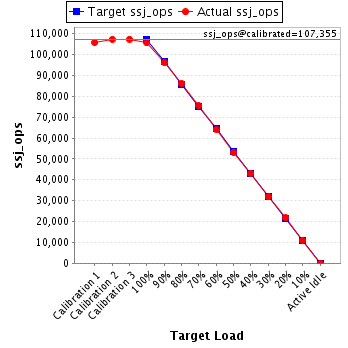
| ssj_ops@calibrated=107,355 | |||
| 100% | 98.3% | 107,355 | 105,583 |
| 90% | 89.6% | 96,619 | 96,239 |
| 80% | 80.3% | 85,884 | 86,239 |
| 70% | 70.3% | 75,148 | 75,419 |
| 60% | 59.7% | 64,413 | 64,049 |
| 50% | 49.5% | 53,677 | 53,176 |
| 40% | 40.0% | 42,942 | 42,929 |
| 30% | 29.7% | 32,206 | 31,859 |
| 20% | 20.3% | 21,471 | 21,761 |
| 10% | 10.3% | 10,735 | 11,004 |
| Active Idle | 0 | 0 | |
| Target Load | Actual Load | ssj_ops | |
|---|---|---|---|
| Target | Actual | ||
| Calibration 1 | 106,206 | ||
| Calibration 2 | 108,182 | ||
| Calibration 3 | 108,350 | ||
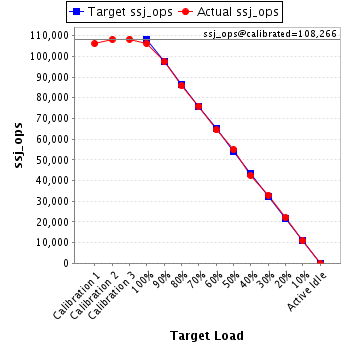
| ssj_ops@calibrated=108,266 | |||
| 100% | 98.1% | 108,266 | 106,202 |
| 90% | 90.0% | 97,439 | 97,432 |
| 80% | 79.2% | 86,613 | 85,753 |
| 70% | 70.2% | 75,786 | 75,974 |
| 60% | 59.6% | 64,959 | 64,494 |
| 50% | 50.8% | 54,133 | 55,042 |
| 40% | 39.3% | 43,306 | 42,521 |
| 30% | 30.4% | 32,480 | 32,890 |
| 20% | 20.4% | 21,653 | 22,102 |
| 10% | 10.1% | 10,827 | 10,883 |
| Active Idle | 0 | 0 | |
| Target Load | Actual Load | ssj_ops | |
|---|---|---|---|
| Target | Actual | ||
| Calibration 1 | 104,871 | ||
| Calibration 2 | 106,840 | ||
| Calibration 3 | 107,010 | ||
| ssj_ops@calibrated=106,925 | |||
| 100% | 98.7% | 106,925 | 105,563 |
| 90% | 90.4% | 96,232 | 96,639 |
| 80% | 80.7% | 85,540 | 86,290 |
| 70% | 69.6% | 74,847 | 74,404 |
| 60% | 60.5% | 64,155 | 64,666 |
| 50% | 49.6% | 53,462 | 53,049 |
| 40% | 40.0% | 42,770 | 42,724 |
| 30% | 30.0% | 32,077 | 32,066 |
| 20% | 20.1% | 21,385 | 21,487 |
| 10% | 10.0% | 10,692 | 10,716 |
| Active Idle | 0 | 0 | |

| Target Load | Actual Load | ssj_ops | |
|---|---|---|---|
| Target | Actual | ||
| Calibration 1 | 106,197 | ||
| Calibration 2 | 108,036 | ||
| Calibration 3 | 108,202 | ||
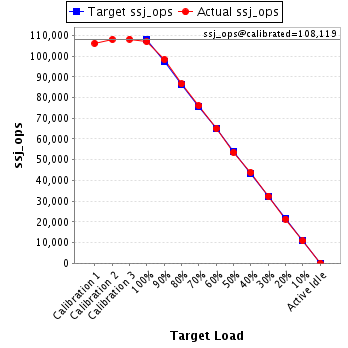
| ssj_ops@calibrated=108,119 | |||
| 100% | 99.0% | 108,119 | 107,002 |
| 90% | 91.0% | 97,307 | 98,396 |
| 80% | 80.1% | 86,495 | 86,572 |
| 70% | 70.3% | 75,683 | 76,051 |
| 60% | 60.2% | 64,871 | 65,083 |
| 50% | 49.5% | 54,059 | 53,543 |
| 40% | 40.5% | 43,248 | 43,805 |
| 30% | 30.0% | 32,436 | 32,402 |
| 20% | 19.8% | 21,624 | 21,366 |
| 10% | 10.0% | 10,812 | 10,821 |
| Active Idle | 0 | 0 | |
| Target Load | Actual Load | ssj_ops | |
|---|---|---|---|
| Target | Actual | ||
| Calibration 1 | 105,946 | ||
| Calibration 2 | 107,924 | ||
| Calibration 3 | 108,058 | ||
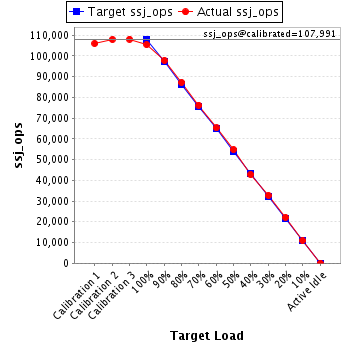
| ssj_ops@calibrated=107,991 | |||
| 100% | 97.6% | 107,991 | 105,353 |
| 90% | 90.6% | 97,192 | 97,846 |
| 80% | 80.8% | 86,393 | 87,222 |
| 70% | 70.6% | 75,594 | 76,226 |
| 60% | 60.4% | 64,795 | 65,261 |
| 50% | 50.7% | 53,995 | 54,776 |
| 40% | 39.6% | 43,196 | 42,712 |
| 30% | 30.3% | 32,397 | 32,738 |
| 20% | 20.5% | 21,598 | 22,119 |
| 10% | 10.2% | 10,799 | 10,988 |
| Active Idle | 0 | 0 | |