
SPECpower_ssj2008
Host 'node1' Performance Report
Copyright © 2007-2010 Standard Performance Evaluation Corporation
| Hewlett-Packard Company ProLiant SL2x170z G6 | ssj_ops@100% = 527,096 ssj_ops@100% per JVM = 131,774 |
||||
| Test Sponsor: | Hewlett-Packard Company | SPEC License #: | 3 | Test Method: | Multi Node |
| Tested By: | Hewlett-Packard Company | Test Location: | Houston, TX, USA | Test Date: | May 3, 2010 |
| Hardware Availability: | Jun-2010 | Software Availability: | Jul-2009 | Publication: | Jun 2, 2010 |
| System Source: | Single Supplier | System Designation: | Server | Power Provisioning: | Line-powered |
| Target Load | Actual Load | ssj_ops | |
|---|---|---|---|
| Target | Actual | ||
| Calibration 1 | 526,275 | ||
| Calibration 2 | 528,326 | ||
| Calibration 3 | 528,192 | ||
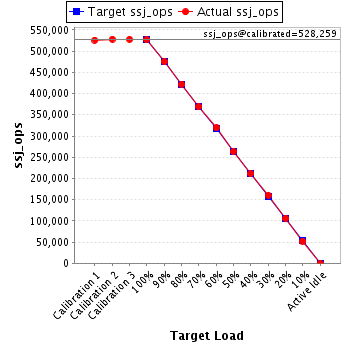
| ssj_ops@calibrated=528,259 | |||
| 100% | 99.8% | 528,259 | 527,096 |
| 90% | 90.0% | 475,433 | 475,358 |
| 80% | 80.0% | 422,607 | 422,563 |
| 70% | 69.9% | 369,781 | 368,996 |
| 60% | 60.5% | 316,955 | 319,525 |
| 50% | 49.9% | 264,130 | 263,500 |
| 40% | 40.0% | 211,304 | 211,368 |
| 30% | 30.3% | 158,478 | 160,284 |
| 20% | 20.1% | 105,652 | 106,136 |
| 10% | 9.9% | 52,826 | 52,290 |
| Active Idle | 0 | 0 | |
| Set Identifier: | sut |
| Set Description: | ProLiant SL2x170z G6 |
| # of Identical Nodes: | 4 |
| Comment: | None |
| Hardware | |
|---|---|
| Hardware Vendor: | Hewlett-Packard Company |
| Model: | ProLiant SL2x170z G6 |
| Form Factor: | 2U |
| CPU Name: | Intel Xeon L5530 |
| CPU Characteristics: | Quad-Core, 2.40 GHz, 8 MB L3 cache |
| CPU Frequency (MHz): | 2400 |
| CPU(s) Enabled: | 8 cores, 2 chips, 4 cores/chip |
| Hardware Threads: | 16 (2 / core) |
| CPU(s) Orderable: | 1,2 chips |
| Primary Cache: | 32 KB I + 32 KB D on chip per core |
| Secondary Cache: | 256 KB I+D on chip per core |
| Tertiary Cache: | 8 MB I+D on chip per chip |
| Other Cache: | None |
| Memory Amount (GB): | 8 |
| # and size of DIMM: | 4 x 2048 MB |
| Memory Details: | 2GB 2Rx8 PC3-10600E; slots 1 and 4 are populated on each processor |
| Power Supply Quantity and Rating (W): | None |
| Power Supply Details: | Shared |
| Disk Drive: | 1 x 60GB 3G SATA 2.5in QR MDL SSD, HP part #:586585-B21 |
| Disk Controller: | Integrated SATA |
| # and type of Network Interface Cards (NICs) Installed: | 2 x HP NC362i Dual Port Multifunction Gigabit Server Adapters |
| NICs Enabled in Firmware / OS / Connected: | 2/2/1 |
| Network Speed (Mbit): | 1000 |
| Keyboard: | None |
| Mouse: | None |
| Monitor: | None |
| Optical Drives: | No |
| Other Hardware: | None |
| Software | |
|---|---|
| Power Management: | Power saver plan in OS |
| Operating System (OS): | Windows Server 2008 x64, Enterprise Edition |
| OS Version: | SP2 |
| Filesystem: | NTFS |
| JVM Vendor: | IBM Corporation |
| JVM Version: | IBM J9 VM (build 2.4, J2RE 1.6.0 IBM J9 2.4 Windows Server 2008 amd64-64 jvmwa6460sr5-20090519_35743 (JIT enabled, AOT enabled) |
| JVM Command-line Options: | -Xaggressive -Xcompressedrefs -Xgcpolicy:gencon -Xmn1100m -Xms1600m -Xmx1600m -XlockReservation -Xnoloa -XtlhPrefetch -Xlp -Xgcthreads4 |
| JVM Affinity: | start /affinity [0xF, 0xF0, 0xF00, 0xF000] |
| JVM Instances: | 4 |
| JVM Initial Heap (MB): | 1600 |
| JVM Maximum Heap (MB): | 1600 |
| JVM Address Bits: | 64 |
| Boot Firmware Version: | O34 8/25/09 |
| Management Firmware Version: | 4.04 7/1/09 |
| Workload Version: | SSJ 1.2.6 |
| Director Location: | Controller |
| Other Software: | NIC driver, HP component cp010296.exe. Driver version: 10.3.49.400 |
| JVM Instance | ssj_ops@100% |
|---|---|
| node1.001 | 133,036 |
| node1.002 | 131,840 |
| node1.003 | 132,046 |
| node1.004 | 130,174 |
| ssj_ops@100% | 527,096 |
| ssj_ops@100% per JVM | 131,774 |

| Target Load | Actual Load | ssj_ops | |
|---|---|---|---|
| Target | Actual | ||
| Calibration 1 | 133,478 | ||
| Calibration 2 | 133,902 | ||
| Calibration 3 | 133,732 | ||
| ssj_ops@calibrated=133,817 | |||
| 100% | 99.4% | 133,817 | 133,036 |
| 90% | 90.6% | 120,435 | 121,289 |
| 80% | 80.0% | 107,054 | 107,085 |
| 70% | 69.3% | 93,672 | 92,755 |
| 60% | 60.6% | 80,290 | 81,073 |
| 50% | 49.5% | 66,908 | 66,272 |
| 40% | 39.7% | 53,527 | 53,181 |
| 30% | 30.4% | 40,145 | 40,628 |
| 20% | 20.0% | 26,763 | 26,743 |
| 10% | 9.9% | 13,382 | 13,222 |
| Active Idle | 0 | 0 | |

| Target Load | Actual Load | ssj_ops | |
|---|---|---|---|
| Target | Actual | ||
| Calibration 1 | 131,996 | ||
| Calibration 2 | 132,456 | ||
| Calibration 3 | 131,720 | ||
| ssj_ops@calibrated=132,088 | |||
| 100% | 99.8% | 132,088 | 131,840 |
| 90% | 90.4% | 118,879 | 119,394 |
| 80% | 80.0% | 105,670 | 105,626 |
| 70% | 70.9% | 92,462 | 93,612 |
| 60% | 60.4% | 79,253 | 79,818 |
| 50% | 50.0% | 66,044 | 66,079 |
| 40% | 39.9% | 52,835 | 52,767 |
| 30% | 30.4% | 39,626 | 40,185 |
| 20% | 20.4% | 26,418 | 27,001 |
| 10% | 10.0% | 13,209 | 13,191 |
| Active Idle | 0 | 0 | |

| Target Load | Actual Load | ssj_ops | |
|---|---|---|---|
| Target | Actual | ||
| Calibration 1 | 131,233 | ||
| Calibration 2 | 131,382 | ||
| Calibration 3 | 132,235 | ||
| ssj_ops@calibrated=131,809 | |||
| 100% | 100.2% | 131,809 | 132,046 |
| 90% | 89.6% | 118,628 | 118,080 |
| 80% | 80.0% | 105,447 | 105,405 |
| 70% | 69.1% | 92,266 | 91,081 |
| 60% | 60.7% | 79,085 | 80,073 |
| 50% | 50.6% | 65,904 | 66,641 |
| 40% | 40.3% | 52,723 | 53,158 |
| 30% | 30.3% | 39,543 | 39,927 |
| 20% | 20.1% | 26,362 | 26,483 |
| 10% | 9.8% | 13,181 | 12,950 |
| Active Idle | 0 | 0 | |

| Target Load | Actual Load | ssj_ops | |
|---|---|---|---|
| Target | Actual | ||
| Calibration 1 | 129,568 | ||
| Calibration 2 | 130,587 | ||
| Calibration 3 | 130,505 | ||
| ssj_ops@calibrated=130,546 | |||
| 100% | 99.7% | 130,546 | 130,174 |
| 90% | 89.3% | 117,491 | 116,595 |
| 80% | 80.0% | 104,436 | 104,448 |
| 70% | 70.1% | 91,382 | 91,548 |
| 60% | 60.2% | 78,327 | 78,561 |
| 50% | 49.4% | 65,273 | 64,509 |
| 40% | 40.0% | 52,218 | 52,262 |
| 30% | 30.3% | 39,164 | 39,545 |
| 20% | 19.8% | 26,109 | 25,909 |
| 10% | 9.9% | 13,055 | 12,927 |
| Active Idle | 0 | 0 | |
