SPECpower_ssj2008
Aggregate Performance Report
Copyright © 2007-2009 Standard Performance Evaluation Corporation
| IBM Corporation IBM System x iDataPlex dx360 M2 | ssj_ops@100% = 1,069,123 ssj_ops@100% per Host = 534,562 ssj_ops@100% per JVM = 133,640 |
||||
| Test Sponsor: | IBM Corporation | SPEC License #: | 11 | Test Method: | Multi Node |
| Tested By: | IBM Corporation | Test Location: | Nankang, Taipei, Taiwan | Test Date: | Jul 1, 2009 |
| Hardware Availability: | Sep-2009 | Software Availability: | Jun-2009 | Publication: | Aug 27, 2009 |
| System Source: | Single Supplier | System Designation: | Server | Power Provisioning: | Line-powered |
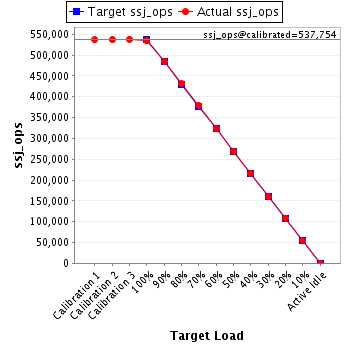
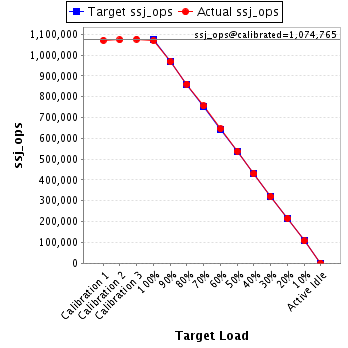
| Target Load | Actual Load | ssj_ops | |
|---|---|---|---|
| Target | Actual | ||
| Calibration 1 | 1,070,386 | ||
| Calibration 2 | 1,073,117 | ||
| Calibration 3 | 1,076,413 | ||
| ssj_ops@calibrated=1,074,765 | |||
| 100% | 99.5% | 1,074,765 | 1,069,123 |
| 90% | 90.1% | 967,289 | 968,360 |
| 80% | 80.0% | 859,812 | 860,348 |
| 70% | 70.3% | 752,336 | 755,466 |
| 60% | 60.0% | 644,859 | 645,283 |
| 50% | 50.1% | 537,383 | 537,921 |
| 40% | 40.0% | 429,906 | 429,474 |
| 30% | 29.8% | 322,430 | 320,717 |
| 20% | 20.1% | 214,953 | 216,000 |
| 10% | 10.0% | 107,477 | 107,811 |
| Active Idle | 0 | 0 | |
| # of Nodes | # of Chips | # of Cores | # of Threads | Total RAM (GB) | # of OS Images | # of JVM Instances |
|---|---|---|---|---|---|---|
| 2 | 4 | 16 | 32 | 16.0 | 2 | 8 |
| Set Identifier: | sut |
| Set Description: | System Under Test |
| # of Identical Nodes: | 2 |
| Comment: | None |
| Hardware per Node | |
|---|---|
| Hardware Vendor: | IBM Corporation |
| Model: | IBM System x iDataPlex dx360 M2 |
| Form Factor: | 2U |
| CPU Name: | Intel Xeon L5530 |
| CPU Characteristics: | Quad-Core, 2.40GHz, 8MB L3 Cache |
| CPU Frequency (MHz): | 2400 |
| CPU(s) Enabled: | 8 cores, 2 chips, 4 cores/chip |
| Hardware Threads: | 16 (2 / core) |
| CPU(s) Orderable: | 1,2 chips |
| Primary Cache: | 32 KB I + 32 KB D on chip per core |
| Secondary Cache: | 256 KB I+D on chip per core |
| Tertiary Cache: | 8 MB I+D on chip per chip |
| Other Cache: | None |
| Memory Amount (GB): | 8 |
| # and size of DIMM: | 4 x 2048 MB |
| Memory Details: | Samsung M393B5673EH1-CH9 DDR3-10600R CL9 ECC; slots 3, 6, 11 and 14 populated |
| Power Supply Quantity and Rating (W): | None |
| Power Supply Details: | Shared |
| Disk Drive: | 1 x 32 GB SATA SSD, Sandisk P/N: SDS5C-032G-103500; Model: SSD SATA 5000 2.5" |
| Disk Controller: | Integrated SATA controller |
| # and type of Network Interface Cards (NICs) Installed: | 2 x Integrated Intel 82575 Gigabit Ethernet Controller |
| NICs Enabled in Firmware / OS / Connected: | 1/1/1 |
| Network Speed (Mbit): | 1000 |
| Keyboard: | KVM |
| Mouse: | KVM |
| Monitor: | KVM |
| Optical Drives: | No |
| Other Hardware: | None |
| Software per Node | |
|---|---|
| Power Management: | Enabled ("Balanced" power scheme) |
| Operating System (OS): | Windows Server 2008 DataCenter |
| OS Version: | 64-bit |
| Filesystem: | NTFS |
| JVM Vendor: | IBM Corporation |
| JVM Version: | IBM J9 VM (build 2.4, J2RE 1.6.0 IBM J9 2.4 Windows Server 2008 amd64-64 jvm pwa6460sr5-20090406_01(SR5) (JIT enabled, AOT enabled) |
| JVM Command-line Options: | -Xaggressive -Xcompressedrefs -Xgcpolicy:gencon -Xmn1200m -Xms1675m -Xmx1675m -XlockReservation -Xnoloa -XtlhPrefetch -Xlp |
| JVM Affinity: | start /affinity [000F,00F0,0F00,F000] |
| JVM Instances: | 4 |
| JVM Initial Heap (MB): | 1675 |
| JVM Maximum Heap (MB): | 1675 |
| JVM Address Bits: | 64 |
| Boot Firmware Version: | TME126T |
| Management Firmware Version: | YU0026A |
| Workload Version: | SSJ 1.2.6 |
| Director Location: | Controller |
| Other Software: | None |
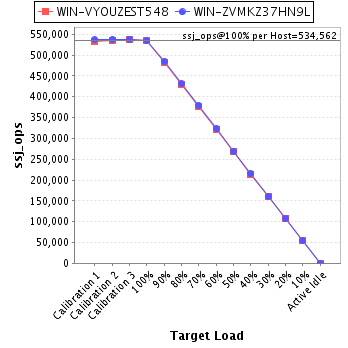
| Host | ssj_ops@100% |
|---|---|
| WIN-VYOUZEST548 | 534,767 |
| WIN-ZVMKZ37HN9L | 534,356 |
| ssj_ops@100% | 1,069,123 |
| ssj_ops@100% per Host | 534,562 |
| ssj_ops@100% per JVM | 133,640 |
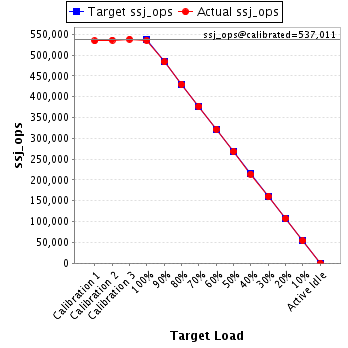
| Target Load | Actual Load | ssj_ops | |
|---|---|---|---|
| Target | Actual | ||
| Calibration 1 | 533,716 | ||
| Calibration 2 | 535,978 | ||
| Calibration 3 | 538,045 | ||
| ssj_ops@calibrated=537,011 | |||
| 100% | 99.6% | 537,011 | 534,767 |
| 90% | 90.0% | 483,310 | 483,330 |
| 80% | 80.0% | 429,609 | 429,388 |
| 70% | 70.1% | 375,908 | 376,613 |
| 60% | 59.9% | 322,207 | 321,782 |
| 50% | 50.0% | 268,506 | 268,428 |
| 40% | 39.9% | 214,805 | 214,003 |
| 30% | 29.9% | 161,103 | 160,518 |
| 20% | 20.0% | 107,402 | 107,358 |
| 10% | 10.1% | 53,701 | 54,169 |
| Active Idle | 0 | 0 | |
| Target Load | Actual Load | ssj_ops | |
|---|---|---|---|
| Target | Actual | ||
| Calibration 1 | 536,670 | ||
| Calibration 2 | 537,140 | ||
| Calibration 3 | 538,368 | ||
| ssj_ops@calibrated=537,754 | |||
| 100% | 99.4% | 537,754 | 534,356 |
| 90% | 90.2% | 483,978 | 485,030 |
| 80% | 80.1% | 430,203 | 430,961 |
| 70% | 70.5% | 376,428 | 378,852 |
| 60% | 60.2% | 322,652 | 323,501 |
| 50% | 50.1% | 268,877 | 269,493 |
| 40% | 40.1% | 215,102 | 215,470 |
| 30% | 29.8% | 161,326 | 160,200 |
| 20% | 20.2% | 107,551 | 108,642 |
| 10% | 10.0% | 53,775 | 53,641 |
| Active Idle | 0 | 0 | |